Introduction to Macroeconomics
Macroeconomics analyses the performance of a nation’s overall economy using macroeconomic indicators like GDP, inflation, unemployment and Government Debt. This section analyses applied macroeconomics used by investors and traders to predict the global economy and countries’ economic and financial markets.
This guide is based to a large extend on the great work of one of the best fund managers and economists in the world, the found of Bridgewater Associated Ray Dalio. You can find a detailed analysis of most section of the guide in his book Big Debt Crises
An economy is the sum of the transactions that make it up. A country’s economy is comprised of the public and private sector. The private sector is comprised of businesses and consumers. There are two types of businesses manufacturing, and services. A country’s economy is also affected by the global economy since capital and products flow between countries.
Economic Aim: A nation’s economy is healthy when there is real economic growth combined with steady inflation, low unemployment, and low debt.
Economic Growth
Economic growth is measured by GDP (Gross Domestic Product). There are two forms of GDP monitored. Nominal GDP and Real GDP. Nominal GDP is the total income of a country in a year. Real GDP is the total income of a country adjusted for inflation.
Inflation
Inflation (commonly measured by the country’s CPI) measures the rate of increase of the average prices of goods and services in an economy. When prices rise the purchasing power of money falls and vice-versa. Policymakers target an inflation rate of 2% which is considered healthy. Zero or negative inflation rates and high inflation rates of 4-5% are damaging for the economy. Hence policymakers react using monetary and fiscal policies. Learn more about the types and positive and negative effects of inflation.
Economic activity is driven by 1. Productivity growth (GDP growth 2% per year due knowledge increase), 2. the Long-term debt cycle (50-75 years), 3. the business cycle (5-8 years).
Credit (promise to pay) is driven by the debt cycle. If credit is used to purchase productive resources, it helps economic growth and income. If credit is used for consumption it has no added value (version 2 expand on this)
These factors cause economic cycles which has the following stages: 1. Expansion, 2. Peak, 3. Recession, 4. Depression, 5. Trough, 6. Recovery. Explore the macroeconomic cycle in detail.
Money and Credit: Economic transactions are filled with either money or credit (promise to pay). The availability of credit is determined by the country’s central bank. The degree to which debt is healthy for the economy depends on whether borrowed money is used productively to generate sufficient income to service the debt or not.
Country versus Rest of the World: A country’s finances consist of a simple income statement (revenue–expenses) and a balance sheet (assets–liabilities). Exports are imports are the main revenue and expense for countries. Uncompetitive economies have negative net income (imports higher than exports), which is financed by either savings (FX & Gold reserves) or rising debt (owed to exporters).Debt: A nation’s debt is categorized as local currency debt and FX debt. Local debt is manageable since a country’s central bank can print money and repay it. FX debt is controlled by foreign central banks hence it is difficult to be repaid. For example. Turkey has US dollar denominated debt. Only the US central bank (the Federal Reserve), can print US dollars hence FX debt is out of Turkey’s control.
A country can control its debt by either: 1. Inflate it away, 2. Restructure, 3. Default. The US aims to keep nominal GDP growth above interest rates (kept low) to gradually reduce its debt.
Economic Growth vs Inflation Model
A nation’s economy is constantly changing and is affected by the country’s macroeconomic dynamics and its economic performance relative to the rest of the World (RoW).
The country’s policymakers (government and central bank) monitor economic conditions and use fiscal policy and monetary policy to control economic growth and inflation.
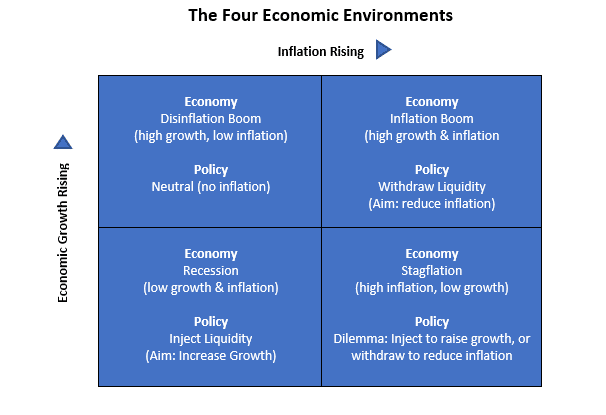
During recessions and depressions policymakers inject liquidity in the financial system to make new borrowing and repaying of existing debt easier. Conversely, during strong economic expansions accompanied with rising inflation, policymakers withdraw liquidity from the financial system to slowdown new debt and credit and reduce aggregate demand.
The diagram below shows what is the policy followed during four economic environments of inflation versus economic growth.
Monetary Policy & Fiscal Policy
Policy makers have the following tools to affect economic growth and inflation:
- Monetary Policy: 1. Money Supply, 2. Interest Rates, 3. CB Balance Sheet, 4. Reserves, 5. QE
- Fiscal Policy: 1. Tax Revenues, 2. Public Spending, 3. Government Debt
Monetary Policies (MP)
- Reduce short-term interest rates > Boost Economic growth by 1. Raising Credit, Easing Debt service
- Print money > purchase financial assets > force investors to take more risk & create wealth effect.
- Print Money > purchase new debt issued to finance Gov. deficits when no local or foreign investors.
Fiscal Policies (FP)
Expansionary FP is when government spends more than tax received to boost economic growth. This is financed by issuing new debt financed by 1. domestic or foreign investors or 2. CB money printing.
Currency vs Injections & Withdrawals
The degree of economic intervention depends on the country’s economic fundamentals, its currency status and credibility. Countries with reserve currencies or strong fundamentals are allowed by markets to intervene. However, when nations with weak economic fundamentals intervene heavily, confidence is lost, causing a capital flight out of the country, spiking inflation and interest rates which lead to a severe recession, political and social crisis.
Investors aim to generate positive real returns and avoid capital losses. If for example, an investor purchases a government bond having a return of 4% but the inflation rate is 5% then the investor’s real return is -1%. Alternatively, if an investor purchases a Turkish government bond to get a 5% return but the Turkish lira depreciates by 18% then the investor’s real return is -13%.
Policymakers must use these tools diligently to boost economic growth while maintaining capital markets’ faith in the country’s economy. Unreliable countries with weak economic fundamentals have limited capacity to use MP and FP to boost economic activity. If their policymakers use aggressive MP and FP they will trigger a loss of confidence in their country, which will lead to capital outflows, a severe currency depreciation, spiking inflation, loss of consumer and business confidence and a destroyed economy.
Reserve vs Non-reserve currencies: Reserve currencies are used by countries and corporations to borrow funds, store wealth and for international transactions (buy commodities). They are considered low risk. The US dollar is the world’s largest reserve currency. The main advantage of reserve currency nations is their ability to borrow (issue debt) on their own currency. These countries have increased power to conduct monetary and fiscal policies to boost their economies. However, prolonged expansionary fiscal and monetary policies eventually lead to loss of confidence in these currencies as a store of value and potential inflationary crisis.
Non-reserve currency countries: Conversely, developing nations are not considered low risk hence their ability to borrow in their own currencies is limited. Their economic growth is dependent on foreign capital inflows denominated in foreign currencies like the US dollar. During periods of global economic growth, capital flows from developed markets into developing nations looking for higher returns. These economies and their corporations’ issue foreign debt to grow. However, during periods of weak global economic growth or financial stress, foreign capital flows (also called capital flight) back to developed countries causing an inability of countries and companies to repay their debt. Central banks gather foreign exchange reserves during growth periods to create a cushion against capital outflows.
Global Growth, Risk and Capital flows: Capital flows between low and high-risk countries and financial assets depending on global economic and risk conditions. During periods of global growth, capital flows from low-risk economies and markets to riskier markets looking for higher returns. Conversely, economic recessions and elevated global risk pushes capital back to safe countries and financial assets.
A nation’s economy is vulnerable to economic weakness or financial stress and has limited ability to use monetary and fiscal policy tools when it experiences:
- Non-reserve currency
- Current account deficit: a current account deficit indicates an uncompetitive economy which relies on foreign capital to sustain its spending. Hence, is vulnerable to capital outflows
- Government deficit: a big government deficit indicates an economy relying or rising debt to finance its operations
- Debt/GDP: a high Debt/GDP pushes a nation to borrow large amounts to finance its debt, print money or default. Historically, Debt/GDP higher than 100% is a red warning for economies.
- Low or no foreign exchange reserves: Developing economies are vulnerable to capital flight since foreign exchange reserves provide a cushion against capital outflows
- High external debt: Nations are vulnerable to high external debts which may be caused by a sudden depreciation of their currency or rising foreign interest rates (due to foreign growth)
- High domestic debt
- Negative real interest rates: Lower interest rates than inflation, are not compensating lenders for holding a nation’s debt hence making nation’s currency vulnerable to capital outflows.
- A history of high inflation and negative total returns: Nations with bad history have lack of trust in value of their currency and debt
Macroeconomic Cycles
Initially a developed economy has stable inflation and GDP growth, is competitive, has low Debt and Debt/GDP grows slower than Income/GDP. Emerging countries experience foreign capital inflows, domestic liquidity is robust keeping interest rates low, balance of payments is positive and the country’s currency, stocks, bonds generate positive total returns. The central bank has two options: 1. print money, buy FX reserves and keep the currency stable or 2. Let the currency appreciate.
Growth Phase
Economic growth and inflation accelerate driven by rising debt and credit availability. Rising incomes lead to rising asset prices which lead to rising debt growth. Debt/GDP rises faster than Income/GDP. Emerging markets experience a bubble triggered by high foreign capital flows and rising Debt/GDP. Country’s competitivness falls while economic growth is strong supported by consumption driven by rising domestic and foreign debt. The country’s current account deteriorates while the currency, stocks, bonds rise for a period of 5-10 years.
Cycle Peak
After a prolonged economic growth period growth and inflation is high and financial markets are overpriced and ready for a bear market. The peak is often triggered by liquidity tightening caused by either 1. central bank raising rates to control inflation or 2. foreign capital outflows. Emerging markets experience an inflationary depression and/or political crisis since foreign capital outflows cause interest rates and inflation to rise and economic growth to collapse. The central bank intervenes in the FX market to defend the currency using its FX reserves and raises short-term rates to prevent capital flight. The optimum central bank strategy is a big one-off devaluation to avoid FX reserve depletion and a prolonged stagflation.
Recession or Depression
If the economy’s long-term debt cycle is rising, the economy experiences a normal recession with an imbalance between money and debt service. The central bank lowers short-term rates to stimulate the economy through the 1. wealth effect, 2. Rising demand for interest rate sensitive goods, 3. Ease of debt service (reduction of monthly loan payments).
If the economy’s long-term debt cycle has rolled over, the economy faces a depression. Debt levels have reached a plateau and cannot rise further relative to incomes. The only solution is to reduce debt burdens and debt service to achieve an economic recovery. The deleveraging (debt reduction) starts with rising defaults and austerity to repay debts. Debtors are pushed to sell their assets to raise cash since they have insufficient income and are unable to borrow. Borrowers creditworthiness deteriorates since debt/income and debt/net-worth ratios rise.
The central bank reduces short-term rates to zero, but this is insufficient to stimulate the economy. The second monetary policy tool used is to print money and buy long-term government bonds to lower long-term rates and force investors make riskier investments and bring economic recovery. This works when risk premiums are high but has a diminishing effect. Governments 1. encourage credit creation, 2. ease rules to help debtors’ services their debt, 3. print and spend money to buy goods, services, and financial assets.
The third monetary policy tool is money printing and boost of aggregate demand by either 1. Debt financed fiscal spending (treasury issues new debt, the central bank buys this debt with printed money), and/or 2. Cash transfers to households.
Emerging markets face an economic depression after foreign capital outflows. The currency is devalued causing foreign debt to explode, GDP to fall and unemployment to rise. The current account improves since imports fall while exports rise. Stocks fall 50% in local terms, while the currency loses 30%. Short-term rates rise, the yield curve inverts, and printing is limited. Inflation picks up and the country needs IMF and BIS support to fix it’s foreign exchange imbalances.
Normalization
The central bank and government aim to achieve economic recovery by balancing the deflationary forces of austerity, defaults, redistribution of wealth with the inflationary forces of money printing and currency depreciation to bring nominal growth above nominal interest rates. Normalization takes 5-10 years for the economy to reach prior peak. Debt burdens fall relative to incomes with positive economic growth.
High debt service payments (principal and interest combined) rather than high debt levels cause debt squeezes because cash flows rather than debt levels slow the economy. If interest rates fall enough, debts can increase without debt service payments rising enough to cause a squeeze.
Emerging markets normalization occurs when the FX market is stable after devaluation (undervalued -10% on PPP), inflation is falling and stable, trade balance is good, financial assets generate positive total returns, the yield curve is normalized with low domestic interest rates and high long rates. The country is competitive to grow again attracting foreign capital flows.
Note: if a developed country with a reserve currency keeps inflation high to keep growth strong by using expansionary fiscal and monetary policies it will eventually erode its reserve currency as store of wealth and convert a deflationary crisis to an inflationary crisis.
MacroVar macroeconomic analysis
MacroVar database holds historical data of more than x macroeconomic indicators for the largest 35 countries in the world.
A country’s macroeconomy is analysed using the indicators below.

Get a snapshot of a country’s economy using:
- Economic Growth variables
- United States: use ISM Manufacturing New Orders
- Europe: use ESI Manufacturing New Orders
- Other Countries: use Manufacturing PMI
- Inflation variables
- United States: use ISM Manufacturing prices
- Europe: use ESI Manufacturing Prices
- Other Countries: CPI & PPI
To further analyze a country’s macroeconomy, the following parameters must be closely monitored:
- Business Confidence: UMSCI, Manufacturing PMI, Services PMI, Construction PMI, Permits, Employment (ESR), ESI, Consumer Confidence, Real Estate Index
- Inflation Conditions: Leading: ISM Prices, ESI Prices – Coincident: CPI, CPI Core, PPI, PPI
- Trade: CA (BOP): Trade surplus = exports > imports, FX demand
- Fiscal Policy:
- Current Surplus/Deficit: rising deficit, injection > inflationary > debt rising
- Debt/GDP: growth dependent on public spending, rising Debt/GDP (more spending injections) > must keep rates low / raise MS (interest bill kept low), else default or deflate (not desirable)
- Interest bill: interest bill % GDP
- Liquidity Cover: government ability to pay its interest bill (tax revenues # Interest bill)
- Monetary Policy:
- MP1: M2, Interest rates, Reserve Requirement
- MP2: Central Bank Balance sheet
- News flow: Politics
Which countries succeed or fail
Which countries succeed or fail
A country’s success is determined by three factors: 1. Productivity: producing more by working harder or smarter, 2. Culture: Sacrificing life for achievement, innovation, commercialism, low bureaucracy, corruption, rule of law, 3. Indebtedness: low debt to income.
Ray Dalio has analysed extensively all the factors determining a country’s economic success. Click here to read this paper.
Financial Markets versus the four Macroeconomic Environments
There are four macroeconomic environments based on economic growth and inflationary conditions. MacroVar uses this model to monitor macroeconomic conditions for the largest 35 countries in the world.
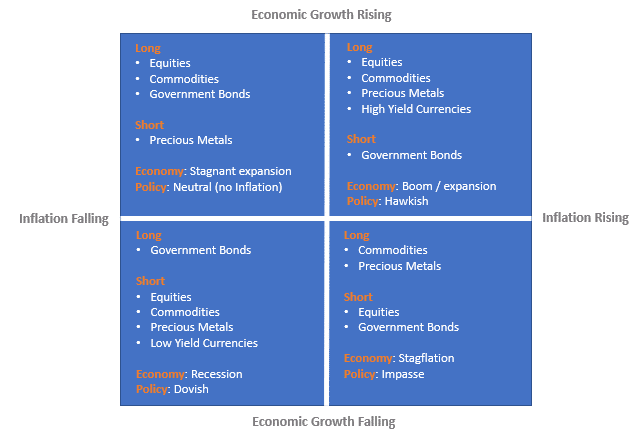
- Inflation boom: Accelerating Economic growth with rising inflation
During these macroeconomic conditions economic growth is strong, capacity utilization is high and hence rising inflation is experienced. Policy makers use monetary policy and fiscal policy tools to slowdown the economy and bring inflation down.
High global growth with rising inflation expectations lifts commodities. Many emerging economies growth is linked to commodities. When commodities rise emerging market stocks, currencies and real estate rise as well.
During this environment, global growth is strong and global risk is low. Capital flows out of safe developed low growth countries like the US into emerging markets.
The best performing financial assets are emerging market stocks, international real estate, emerging countries’ currencies, commodities, and IL bonds (inflation linked bonds).
The worst performing financial assets are US treasury bonds and cash since they are adversely affected by rising inflation.
- Stagflation: Slowing Economic Growth with Rising Inflation
The best asset performers protecting investors from inflation are Gold, Cash, Treasury Inflation Protected Securities, and the US Dollar.
The worst performers are long-duration treasury bonds adversely affected by rising inflation.
- Disinflation boom: Accelerating Economic growth with Slowing Inflation
The best performers are developed markets stocks, developed Real estate and US Treasury bonds.
Low inflation with moderate growth is a good environment for bonds and stocks and bad for the worst performs which are commodities and commodity related sectors.
- Deflation Bust: Slowing Economic Growth with Falling Inflation
During this environment the best asset performers are Long-Duration Treasuries and Cash. Everything else experiences big volatility and often large losses.