Revolutionizing the World of Fixed Income Trading: Insights & Factors
The fixed income market is one of the main pillars for managing an investment portfolio and understanding the functioning of global markets and macroeconomics. Bank credit and debt capital markets are the lifeblood of the financial system.
MacroVar monitors sovereign bonds, corporate bonds, credit default swaps, global yield curves, STIR (short-term interest rates), Interest Rate Swaps, US/EU/GB 3-month LIBOR futures, SOFR, SONIA and fed funds Futures, Eurodollar futures.
MacroVar uses several factors that allow traders to analyse and trade different sectors of the fixed income market.
Fixed Income Factor Analysis
Government Bonds
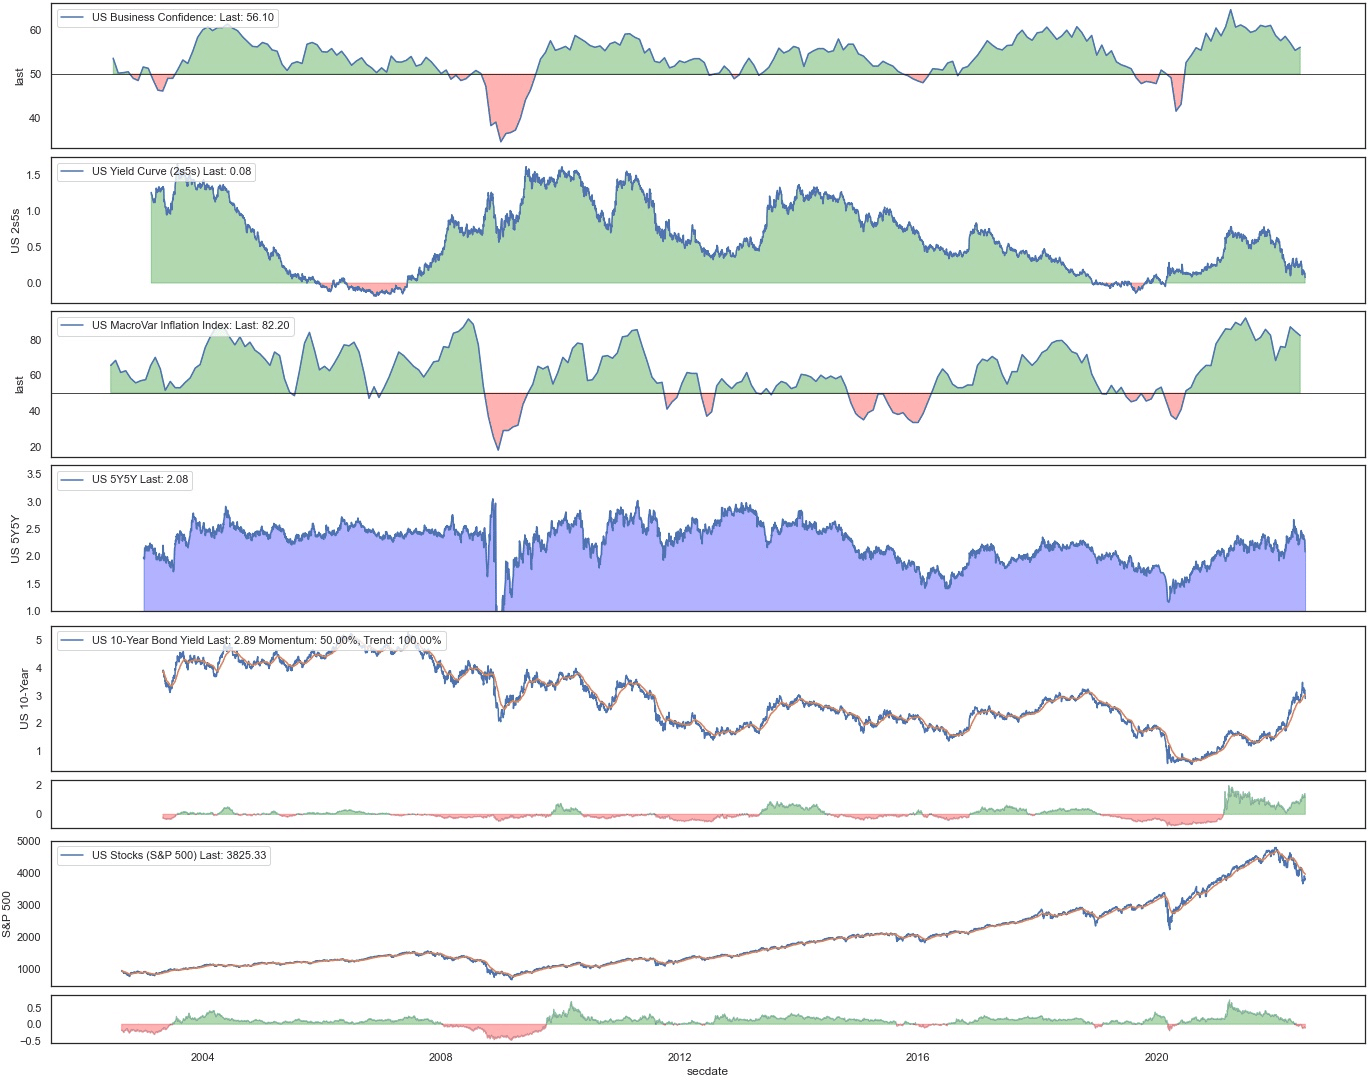
MacroVar financial models monitor short-term (2-year), medium-term (5-year) and long-term (10-year) government bonds and the dynamics of the yield curves for the largest 30 economies in the world.
The short-term (2-year) bond is driven by the market expectations of the central bank’s decisions while the 10-year bond is driven by inflation / growth market expectations.
Moreover, MacroVar analyzes the following financial and macroeconomic factors using statistical models:
- Macroeconomic Surveys Dynamics vs Government bonds
- Inflation Index Dynamics vs Government bonds
- Exchange Rate Dynamics vs Government bonds
- Stock Market Dynamics vs Government bonds
- Inflation Protected Bonds Dynamics
Government bonds are closely correlated with the levels and dynamics of inflation. However, CPI which is the standard macroeconomic indicator to track inflation is a coincident indicator. In order to track inflationary expectations 1-3 months in the future, MacroVar analyzes price dynamics from manufacturing and services surveys like the ISM, NMI, PMI and ESI.
Corporate bonds
Corporate bonds are bonds issued by large corporations, to finance projects or their business activity.
Corporate bonds are closely correlated with stocks and since bond investors are more diligent in analyzing credit risk, their decisions represented by credit spreads are often leading indicators for stocks.
MacroVar statistical models analyze the dynamics between stock indices, stock sectors versus credit default swaps and corporate bond indices to identify investing opportunities when divergences between the different markets occur.

credit cycle
MacroVar monitors credit default swaps of more than 500 individual companies and indexes as well as IBOXX corporate bond indices for 80 sectors and industries of the United States and 50 sectors and industries of the European corporate bond market.
Get an overview view of credit default swaps and corporate credit markets.
Fixed Income Logic
Investors trade government bonds based on their expectations of future economic growth and inflation.
The most important criteria to categorize government bonds are:
- Government Bond maturity (Short-term bonds: 1 to 4-year maturity, Long-Term bonds: 10-year to 30-year maturity)
- Government Bond Credit risk based on the country’s credit profile
Government bonds are highly correlated with the factors presented below. However, during extreme economic downturns, central banks use extraordinary measures to combat recessions like extensive quantitative easing programs (money printing) with which they purchase government bonds of all maturities hence distorting price discovery.
The factors affecting government bonds are summarized with the case studies below:
Low-Risk Government bonds like the US and Germany 10-year bonds rally on global slowdown conditions during low inflation environments.
Government bonds are closely correlated with the country’s economy expectations. When leading economic indicators show economic slowdown government bonds rise. Leading indicators used to gauge the country’s economic expectations are the following:
- All economies: Manufacturing PMI, Housing activity, Domestic Banks exposure.
- Commodity dependent economies: Commodity trends and momentum
- Export oriented economies: e.g. Germany exports to China, Australian exports to China
- Geopolitical Events: Brexit, Political Crisis (Italy), Trade wars, Tariffs
- Central Bank Expected Interventions: e.g. Front-running ECB Quantitative Easing programs for Italian Bonds
- Emerging market Bonds: During rising global risk conditions, capital moves out of emerging market bonds into low-risk assets like US 10-year treasuries and German Bunds
- Government infrastructure programs: New debt issuance to finance new projects lead to a fall in both short-term and long-term bonds.
Government Bonds and Credit Risk
The government bonds considered the low-risk investments and used for capital protection during recessions and downturns are the US 10-year Treasury note bond and the German 10-year bond.
The government bonds which considered high risk are the bonds of emerging market countries like Turkey and Hungary, and countries of southern Europe namely Spain, Italy, Portugal, and Greece.
Government Bonds and the factors affecting them
MacroVar monitors government bonds of 2-year, 5-year and 10-year maturities for the 25 biggest economies in the world.
Short-term government bonds (the 2-year government bond is the benchmark for short-term bonds) is driven by the market’s expectation of the central bank future moves. The long-term government bonds (the 10-year government bond is used as the benchmark of long-term bonds) is driven by the market’s expectations of inflation and economic growth.
Inflation Expectations
Inflation is the most critical factor affecting government bonds. A government bond’s coupon rate is fixed for the bond’s life. Hence during inflationary conditions, the price of government bonds tends to drop, because the bond may not be paying enough interest to stay ahead of inflation.
Long-term government bonds offer higher interest rates than short-term government bonds to account for the increased probability of inflation rising at some point during the bond’s life.
Financial health of Country
The financial health of the country issuing the government bonds affects the coupon rate the bond is issued with. Countries with low credit risk issue bonds with lower interest rates, while those countries with higher credit risk like some emerging market countries will have to offer higher rates to incentivize investors.
Government Bonds and the Economy
Real economic growth expectations and the inflation outlook of the global economy drive all financial assets. There are 4 economic environments based on economic growth and inflationary conditions.
- Inflation boom: Accelerating Economic growth with Rising inflation
- Stagflation: Slowing Economic Growth with Rising Inflation
- Disinflation boom: Accelerating Economic growth with Slowing Inflation
- Deflation Bust: Slowing Economic Growth with Falling Inflation
During an inflationary boom with strong economic growth and inflation, high yield bonds are well performing investment vehicles while government bonds are the worst performing financial assets.
During stagflation which is an economic environment of falling inflation and slowing economic growth government bonds are the best performing financial assets while high yield bonds are one fo the worst performing financial assets.
During disinflationary boom, with strong economic growth and falling inflation, government bonds are the best performing assets and high yield bonds are also good performing assets.
Deflationary busts are economic environments with falling economic growth and falling inflation. During this environment safe government bonds like US treasuries and German bunds are the best performing assets while high yield bonds are one of the worst performing assets.
Long-term government bonds are the best financial assets during periods of environments of deflation and disinflation. Government bonds are the worst financial assets during periods of inflationary booms with rising inflation and stagflation.
Bond Types versus the Economy
The following bond types outperform and underperform during different phases of the global economy.
Government Bonds and Market Risk
During global economic expansions when inflation expectations are positive, capital flows out of low-risk assets such as US treasuries and German bunds into higher risk financial assets such as stocks. Inside the bond market, during healthy economic conditions capital flows from safe German bunds to riskier bonds of the Eurozone periphery like Italian government bonds and Spanish government bonds and from low-risk US treasuries to other emerging market bonds in search of additional yield.
During economic slowdowns where the market expectation is disinflation funds flow from risky assets like emerging market bonds and stocks to low-risk financial assets like US treasuries and German bunds.
Government long-term bonds perform well during a weak economic environment with low inflation expectations and no economic growth expectations. Moreover, a global bond rally may indicate a rotation from risky assets like stocks to low risk assets like bonds.
Low economic growth can arise from a global slowdown affecting a specific economy, low commodity prices affecting commodity export oriented economies like Canada / Russia, geopolitical events affecting adversely economies like Brexit, a domestic economic slowdown, falling exports for export oriented economies like that of Germany, QE intervention or market front running of QE intervention.
Fiscal interventions like government infrastructure spending projects adversely affect government bonds (both short-term government bonds and long-term government bonds) since they sense increased projected inflation expectations.
Emerging countries are often vulnerable to capital outflows for various reasons. Capital outflows cause heavy losses in emerging countries government bonds. If you want to learn about emerging countries risks and opportunities click our guide on emerging economies.
MacroVar Price Dynamics Models
MacroVar uses quantitative models to monitor trends, momentum and possible inflection points for all bonds monitored. Our Models are open-source, transparent and MacroVar displays these signals in this dashboard and will alert you through MacroVar Newsfeed and Daily newsletter automatically when new signals are generated. You can also access raw data for each financial series including signals from these models by accessing MV database.
MacroVar Momentum Model (M)
Momentum trading is used to capture moves in shorter timeframes than trends. Momentum is the relative change occurring in markets. Relative change is different to a trend. A long-term trend can be up but the short-term momentum of a specific market can be 0.
If a market moves down and then moves up and then moves back down the net relative change in price is 0. That means momentum is 0. A short-term positive momentum, with a long-term downtrend results in markets with no momentum.
MacroVar momentum signal ranges from -100 to +100. The market trend signal is derived as the mean value from 4 calculations for each asset. The timeframes monitored are the following:
- 1 Day (1 trading day)
- 1 Week (5 trading days)
- 1 Month (20 trading days)
- 3 Months (60 trading days)
For each timeframe, the following calculations are performed:
- Calculations of the return for the specific timeframe
- If return calculated is higher than 0, signal value 1 else signal value -1
Finally, the 4 values are aggregated daily. A technical rollover is identified when MacroVar momentum strength indicator moves from positive to negative value or vice-versa.
Value currently 0 meaning that momentum is flat.
Value is -25 meaning a weak -ve momentum is currently present.
Value is -50 meaning a strong -ve momentum is currently present.
Value is -75 meaning a strong -ve momentum is currently present.
Value is -100 meaning a strong -ve momentum is currently present.
Value is +25 meaning a strong +ve momentum is currently present.
Value is +50 meaning a strong +ve momentum is currently present.
Value is +75 meaning a strong -ve momentum is currently present.
Value is +100 meaning a strong -ve momentum is currently present.
MacroVar Trend model (T)
MacroVar Trend signal ranges from -100 to +100. The market trend signal is derived as the mean value from 8 calculations for each asset. The timeframes monitored are the following:
- 1-month (20 trading days)
- 3-months (60 trading days)
- 6-months (125 trading days)
- 1-year (250 trading days)
For each timeframe, the following calculations are performed:
- Closing price vs moving average (MA): if price greater than MA value is +1, else -1
- Moving average slope: if current MA is higher than previous MA, upward slope +1, else -1
MacroVar trend model can be used as a trend strength indicator. MacroVar trend strength values ranging between +75 and +100 or -75 and -100 show strong trend strength.
A technical rollover is identified when MacroVar trend strength indicator moves from positive to negative value or vice-versa.
Value currently 0 meaning that trend is flat.
Value is -25 meaning a weak -ve trend is currently present.
Value is -50 meaning a strong -ve trend is currently present.
Value is -75 meaning a strong -ve trend is currently present.
Value is -100 meaning a strong -ve trend is currently present.
Value is +25 meaning a strong +ve trend is currently present.
Value is +50 meaning a strong +ve trend is currently present.
Value is +75 meaning a strong -ve trend is currently present.
Value is +100 meaning a strong -ve trend is currently present.
MacroVar Bubble model (B)
MacroVar bubble model monitors a financial asset’s price relative to its 252-day moving average to identify possible inflection point. Extreme moves often followed by price reversals have a high probability of occuring when MacroVar bubble indicator is greater than 2.5 or less than -2.5.
The MacroVar bubble model is calculated using the formula: Latest Price – (252-day Moving Average) / (252-day Standard Deviation). It represents a z-score and extreme values are greater than 2.5 and less than -2.5. Other thresholds include -3, +3.
Value is higher than +2.5 or lower than -2.5 meaning that there is a moderate possibility of price reversal from the current trend.
Value is higher than +3 (when Momentum and Trend is +100) or -3 (when Momentum and Trend is -100) meaning that there is a very high probability of price reversal from the current trend.
MacroVar also monitors US sovereign Bond risk through the MOVE index and other indicators to analyze the dynamics of bonds versus the stock market which is critical in using bonds to diversify investment portfolios. This is part of MacroVar’s Risk Management models.
Fixed Income Research
Sign Up to access MacroVar research for Fixed Income.