Europe Technology Credit Spreads MacroVar Financial Signals
MacroVar algorithms have detected the following signals for Europe Technology Credit Spreads. 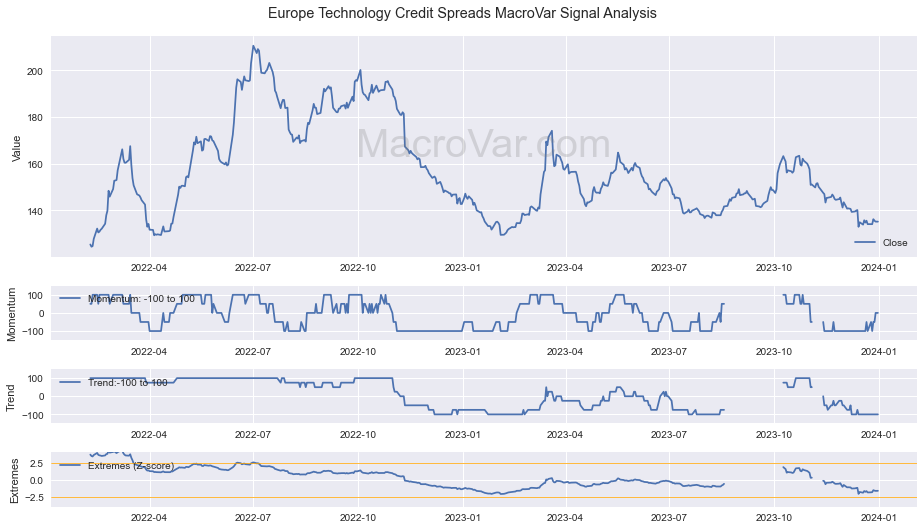
Checkout below the signals related to Europe Technology Credit Spreads momentum, trend and exhaustion.
[rml_read_more] Explore below the signals generated today
| Signal Type | Timeframe | Signal | Last | Previous |
|---|---|---|---|---|
| Trend | Composite | -1.0 | -0.5 | |
| MA Slope | 60-days | Down | -1.0 | 1.0 |
| MA Slope | 250-days | Down | -1.0 | 1.0 |