Mastering Success: The Top-Down Approach in trading
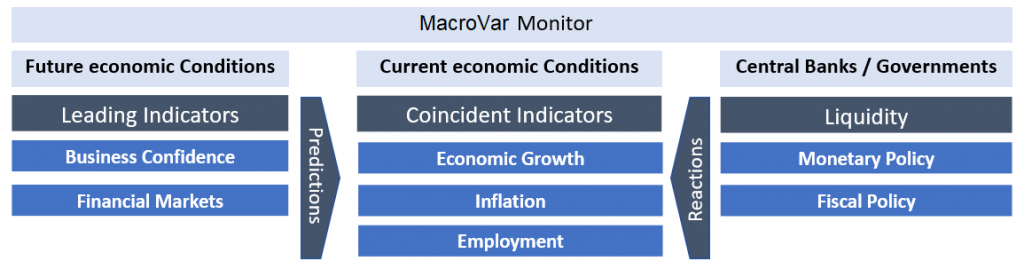
The top down approach in portfolio management seeks to analyse the major components driving the global economy which ultimately drives all financial markets. The most important task of a trader is to predict where market will be in 6-12 months ahead.
The major components of the top down approach are:
- Global Economic Growth Analysis
- Global Inflation outlook
- Global liquidity conditions Analysis
- Global Risk environment Analysis
- Major financial assets Performance
- Factor analysis
- Portfolio & Risk Management Tools
Global Market Dynamics
Analysing the major market indices of major asset classes helps us define the environment we are operating in at any one moment in time.
The major world markets to analyse are: World stock market Index (MSCI), US S&P 500, US Credit Default Swap Index (CDX), Europe Credit Default Swap Index (ITRAXX) and Global G7 10-year bond yields. These should be monitored together global macroeconomic dynamics and global risk dynamics.
These markets should be analyzed using MacroVar quantitative price action models and the trader should constantly ask:
- Where has the Market come from?
- Where is the Market Today?
- Where is the Market going?
During extended phases of robust stock market performance, it’s not advisable to bet against the market. Our trading inclination should lean towards taking long positions.
In contrast, when the stock market is consistently underperforming, taking long positions is not recommended. Instead, our trading focus should be on shorting the market.
In situations where the stock market is largely stagnant, neither long nor short positions are advisable. Our trading strategy should aim for a market-neutral stance, balancing both long and short positions.
Let’s get started with some definitions: What is a Bull Market and a Bear Market
Global Economic Growth Analysis
Global markets are closely correlated with global economic growth. A country’s economic growth is defined by the country’s GDP which is the total income of a country in given year (GDP definition)
The problem with GDP is that it is a lagging indicator of global economic activity. On the other hand, what traders try to predict is future economic activity which is the main reason that drives earnings of companies and as result affect stock markets, bonds and commodities.
Historically, GDP explain 70% of the stock market moves across countries globally. When GDP and stock markets are disconnected, it is because markets are in profit taking or price correction mode while economic growth (GDP) is still in effect. Moreover, historically expansions last longer than contractions, but contractions tend to be much sharper and larger in magnitude.
Aim of Professional traders
Professional traders aim to predict global and individual country’s GDP correctly 60-80% of the time and use Price action to time the market correctly. This will allow them to be right 90%+ of the time and structure manage their portfolios correctly in both bull and bear markets.
Leading Indicators
The most important factor to monitor is global economic growth trends and momentum. Individual country economic growth expectations are gauged using leading macroeconomic indicators. Each country’s Manufacturing PMI and other business and consumer confidence indicators are the leading indicators used by professional traders to predict economic activity.
Global growth is gauged by calculating MacroVar Global PMI based on each country’s weighting to Global GDP of the 35 largest economies monitored and Manufacturing PMI. Special attention is given to the top four largest economies (United States, Eurozone, China, Japan) comprising more than 50% of global GDP. Lastly, global macroeconomic growth breadth is monitored. MacroVar uses the following signals to analyse Macro trends
The Global Economy section presents the current global macroeconomic conditions using different statistics. The largest four economies in the world closely monitored are the US, Eurozone, China and Japan economies comprising more than 50% of Global GDP. MacroVar also monitors the relative performance of Developed and Emerging economies.
Global Liquidity conditions
Global liquidity is a major factor affecting all financial markets. It is of paramount importance to monitor Global Liquidity of the four major central banks in the world namely the Federal Reserve (US), ECB (Eurozone), PBoC (China) and BOJ (China).
MacroVar monitors central banks actions by closely monitoring published statistics and news flow.
Central banks intervene in the money markets to manipulate the supply of funds via interest rates & money supply as well as balance sheet expansion via asset purchase programs to manage inflation & economic growth.
The Central Banks section presents quantitative data and news flow for the four major central banks and secondarily to the rest of the 31 countries monitored.
How Liquidity affects markets
When forming a comprehensive perspective on the economy, it’s crucial to consider not just Economic Growth but also Growth and Liquidity. In any stock market, the Price-to-Earnings ratio (P/E) is a key indicator. Economic Growth influences the “Earnings” part of the ratio, while Liquidity impacts the “Price.”
When there’s a surplus of liquidity, it becomes less expensive to access, driving up the prices of financial assets. On the other hand, when liquidity is limited, its cost rises, exerting downward pressure on asset prices, including those in the stock market.
When we talk about the “cost” or “price” of money, we’re essentially discussing about interest rates. Both governments and corporations borrow funds at rates that are either at or above the current market rates.
The prevailing interest rates have a direct impact on the valuation of equities as an asset class. This is due to macroeconomic factors that influence the relative value of equities versus bonds, as well as microeconomic factors like a company’s debt size and cost, which affect individual stock valuations.
When combined, real interest rates and the yield curve serve as leading indicators that typically change before the overall economy does, specifically in terms of growth and liquidity. Monitoring these indicators can help us forecast GDP, corporate earnings, and the performance of the S&P 500 on both a quarterly and annual basis. This allows us to gauge the direction of economic growth and the state of liquidity.
Understanding the prevailing economic conditions and liquidity is essential for traders to avoid unfavourable positions when there’s a shift in the broader economic landscape. In this context, “Macro” refers to the overarching factors that influence everything.
Real interest rates, which are adjusted for inflation, serve as a leading indicator for future risk asset valuations, such as the S&P 500. Traders can use this information to make timely decisions that capitalize on anticipated market movements.
Similarly, the yield curve reflects the market’s expectations for short-term versus long-term economic risks, which also have implications for risk assets like equities in the S&P 500.
Macroeconomic implications
Generally speaking, when money is more affordable to borrow, market players are likely to take out more loans, leading to increased liquidity. This often results in inflationary pressures and a growing GDP. Conversely, when borrowing is costly, there’s less incentive to take out loans, leading to reduced liquidity and potentially deflationary conditions and a shrinking GDP.
Central banks and governments are aware of this dynamic and actively try to control the money supply by setting official interest rates or intervening in bond markets to influence market rates.
In the context of stock markets, cheaper borrowing costs typically lead to lower volatility due to increased liquidity, while expensive borrowing conditions can result in higher market volatility due to decreased liquidity
Given these relationships, real interest rates (real interest rates benchmarks are: US 2-year real interest rate and the US 10-year interest rate) can be considered as a valuable leading indicator for predicting the direction and volatility of equity markets.
Corporate Liquidity
The cost of capital for businesses is crucial because it influences the mix of equity and debt in the financial structures of a vast number of companies, both in the United States and globally.
If the cost of borrowing, or yield, surges, it directly impacts the future profitability of many major corporations in the U.S. and around the world, especially when they are refinancing their debt. This, in turn, significantly affects various economic indicators like U.S. and global GDP growth, default rates, and employment levels.
Moreover, when borrowing costs are low (i.e., yields are low), market players are more likely to take on debt, leading to economic expansion. Conversely, when borrowing becomes more expensive (i.e., yields are high), there’s a tendency to borrow less, resulting in economic contraction.
As a result, aggregate corporate bond indices serve as a barometer for economic conditions, indicating whether they are likely to be expansionary or contractionary. The yield spreads over benchmark rates in these indices also act as a measure of perceived risk.
When the market senses a higher risk of economic contraction, there’s a sell-off in corporate bonds, leading to higher yields, as well as in other risk-associated assets like equities. On the other hand, when the market anticipates lower risk and potential economic expansion, corporate bonds and risk assets like equities are generally purchased, resulting in lower yields.
Global Risk
Global financial risk conditions are especially important since they affect all financial assets. MacroVar risk index is composed of various financial risk factors to provide an overview of global market risk conditions.
The major risk components monitored are:
- Equity Risk: (Major Indicators: VIX, VSTOXX)
- Credit Risk (Major Indicators: US CDX IG, US CDX HY, EU ITRAXX, CDX Emerging Markets, IBOXX US IG, IBOXX US Banks Senior, IBOXX EU IG, IBOXX EU Banks Senior)
Other risk components monitored by MacroVar Risk index are the following:
- Equity Risk
- Credit Risk
- Liquidity Risk
- Corporate Credit Risk
- Emerging Market Risk
- Global Bank Risk
- Sovereign Risk
- Currencies Risk
- Commodities Risk
The risk index is used for adjusting portfolio risk. MacroVar risk management section provides free current risk analysis.
Global Financial Assets
MacroVar uses a top down framework to analyse financial markets as well. The major financial markets which affect the rest of the other financial assets are:
Stocks
- Global Stocks: ACWI
- US Stocks: S&P 500
- EU Stocks: EuroStoxx
Bonds
- US 10-year treasury rate: US10Y
- German bund rate: DE10Y
- US Short-term Yield Curve: US2s5s
- US Long-term Yield Curve: US2s10s
Currencies
- US Dollar Index: DXY
- Risk Off Currencies: USDJPY, USDCHF
- Emerging Market Currencies: CEW
Commodities
- Crude Oil
- Copper
- Gold
Equity Risk
- US Volatility: VIX, VIX Term structure
- EU Volatility: VSTOXX
- Emerging Market Volatility: VXEEM
Credit Risk
- US Corporate Risk: CDX IG, CDX HY
- EU Corporate Risk: ITRAXX EU
- Emerging Corporate Risk: CDX EEM
Global Macro
- Global PMI
- Developed Economies
- Emerging Markets
Financial Assets Logic
The basic logic on how financial assets behaves during different economic conditions is provided below. There are periods where correlations between financial assets breakdown and where economic data are disconnected from financial markets but the core market logic is described below.
There are two market environments: Risk On periods during which funds flow from safe assets to risky assets and Risk Off periods where funds flow from risky assets to low-risk assets.
Risk Assets (Risk-On): Stocks, Cyclical Commodities, Cyclical Sectors / Industries, High Yield Bonds, Cyclical Currencies, Emerging Markets (Capital flows to emerging markets in search for higher yields, higher growth rates and hence profits)
Safe Assets (Risk-Off): US Treasuries, German Bunds, Defensive Sectors / Industries, US Dollar DXY, Swiss Franc, Japanese Yen, Gold
The most important asset correlation is between the US stocks and US Bonds. During risk on periods US stocks rise while US bonds are sold and vice-versa. Since equities are closely linked with credit, MacroVar monitors closely the performance of corporate bonds for each sector in US and EU markets.
During Risk on Periods the markets behave as follows:
- Global Risk
- Equity Risk (VIX, VSTOXX): falling
- Credit Risk (CDX IG, ITRAXX IG, BofA High Yield credit spreads): falling
- Volatility Term Structure: steep contango
- MacroVar Risk Index: falling
- MacroVar Risk On/Off monitor Ratios: falling
- Stocks
- Global Stocks rising (ideally this should occur with global bond market weakness)
- US Stock Breadth rising
- Emerging Market Stocks rising (often outperforming developed markets like US & EU)
- Global Stock Breadth rising
- Stock Sectors
- Cyclical sectors outperform Defensive sectors
- Sector breadth rising
- Bonds (MacroVar monitors 2-year, 5-year and 10-year bonds)
- Safe Bonds
- US Treasuries falling (yields rising)
- German Bunds falling (yields rising)
- Risky Bonds
- US High Yield Bonds rising (yields falling)
- Europe: Club Med Bonds rising (yields falling)
- Emerging Markets Bonds rising (yields falling)
- Bond interest rates breadth rising (funds move out of bonds into stocks hence yield rates rise)
- Safe Bonds
- Yield Curve
- Yield Curve Bear steepening (on the contrary a Yield Curve bull re-steepening signifies Risk Off environment)
- Fed Funds futures above US 2-year bonds implying strong economic growth and FED hawkish stance
- Yield Curve Steepening Breadth rising
- Eurodollar Futures rising
- Currencies
- US Dollar (DXY) falling
- Safe Currencies (JPY, CHF) falling
- Risky Currencies (AUD, NZD, CAD) rising
- Currencies Breadth (vs the US Dollar) rising
- Commodities
- Energy (Crude Oil) rising
- Metals (Copper) rising
- Safe commodities (Gold) falling
- Commodities Breadth rising
- Macroeconomic Conditions
- Global PMI trend and momentum rising
- Global PMI breadth monitored strong
MacroVar World Markets section is an overview of the major financial markets monitored. Click any of the financial assets to examine the signals of the factors affecting it as well as the asset’s trend, momentum and different statistics monitored.
Country Analysis
MacroVar analyses the economic and financial conditions of the largest 35 economies in the world by monitoring 40 economic and financial indicators for each country.
Country Economic Snapshot
Real economic growth expectations and the inflation outlook of the global economy drive all financial assets. Business confidence and consumer confidence are the major leading indicators predicting a country’s economic growth. When a country’s macroeconomic conditions are dire and there is no possibility of fiscal or monetary stimuli, investors should look to sell rallies and vice-versa.
Countries’ policy makers aim to achieve sustainable economic growth with low unemployment and low inflation. They closely monitor current economic conditions and react accordingly either providing liquidity to the economy to speed up economic activity or recovery or removing liquidity.
Portfolio managers main task is to predict future economic conditions and front run policy makers actions (central banks, governments) by analysing leading market and macroeconomic indicators.
The four economic environments
There are 4 economic environments based on economic growth and inflationary conditions.
Financial assets are affected by economic growth and inflation expectations. The performance of each financial asset for each economic environment is explained below.

- Inflation boom: Accelerating Economic growth with Rising inflation
The best performers are emerging market stocks, international real estate, emerging countries’ currencies, commodities, and TIPS (treasury inflation protected securities).
The worst performers are US treasury bonds and cash since they are adversely affected by rising inflation.
High global growth with rising inflation expectations lifts commodities. Many emerging economies growth is linked to commodities. When commodities rise emerging market stocks, currencies and real estate rise as well.
- Stagflation: Slowing Economic Growth with Rising Inflation
Click to check the Best & Worst Assets during Stagflation
The best asset performers protecting investors from inflation are Gold, Cash, Treasury Inflation Protected Securities, and the US Dollar.
The worst performers are long-duration treasury bonds adversely affected by rising inflation.
- Disinflation boom: Accelerating Economic growth with Slowing Inflation
The best performers are developed markets stocks, developed Real estate and US Treasury bonds.
Low inflation with moderate growth is a good environment for bonds and stocks and bad for the worst performs which are commodities and commodity related sectors.
- Deflation Bust: Slowing Economic Growth with Falling Inflation
During this environment the best asset performers are Long-Duration Treasuries and Cash. Everything else experiences big volatility and often large losses.
During crashes and economic depressions bonds rise while stocks and commodities fall. Investors during these environments look for the safety of their asset rushing into the safety of US treasury bonds and the US dollar while selling stocks and commodities.
MacroVar simpler model monitors the dynamics of Manufacturing PMI as the leading economic indicator to monitor economic conditions. The absolute value and YoY (Momentum) of manufacturing PMI is used to gauge a country’s economic conditions.
MacroVar uses leading economic indicators for each country to predict economic and inflation expectations. More specifically, US ISM PMI components and ESI components for all European countries and the Eurozone are used for structuring this model.
MacroVar also provides a detailed analysis of a country’s economy by analysing more than 30 indicators for each country. Read more about analysing a country’s macroeconomics in detail.
Next Step
Let’s move now to trading idea generation.