| Stock Volatility strategies are executed using variance swaps or volatility swaps.Between 2001 and 2013 the market was paying 3.5% per day over what was actually realized. Implied volatility was 80% of the time higher than realized volatility for S&P 500 1-month variance swap contract.
Every month the same amount of capital is invested in S&P 500 1-month variance swap. The variance swap obligates you at the end of the month to pay realized volatility and receive the predetermined strike whole level is associated with 1 month at-the-money implied volatility.
Alternatively you can sell a 1-month at-the-money options straddle and delta hedge until the maturity (short straddle is option strategy that pays out if prices remain within certain range, meaning low volatility is expected).
S&P 500 volatility premium is driven by high demand (pension funds, 401ks are huge funds with desire to protect from volatility by paying for market “insurance”) and low supply.
1-month S&P 500 volatilities in %, month data (vol premium is right axis- after transaction csots)
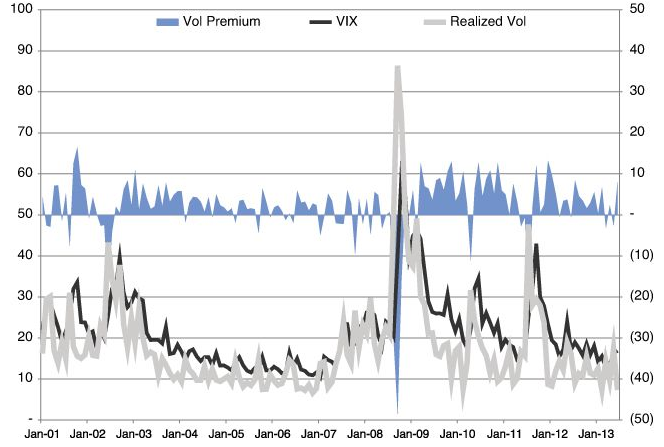
There exists a negative skewed tail risk, meaning that when extreme events occur, the effect is catastrophic. In 2008, naïve volatility strategy would have lost investor close to 85%. In 2009 however, the naïve strategy swung back into profitability and returned 82%.
Market Risk Indicators are implemented to filter calm market periods where significant risk losses are small and other periods where market risk is high. When the market is nervous implied volatility rates spike up and this the time to take risk off.
Market Risk Indicators and Rules applied to this strategy are:
- GARCH Model: if GARCH forecast of conditional variance is high because of market data tremors, you stay out of the trade
- VIX mode: If yesterday’s VIX closes below its own historical average invest in strategy else stay out of the market.
The GARCH signal in 2008 for the months of August through December 2008, GARCH signaled risk-off from the volatility market, hence avoiding loss of more than 90%.
Annualized return of the strategy was 22.4% with annualized volatility of just 11.5% between 2001 and 2012.The strategy’s Sharpe Ratio was 1.90. The strategy’s returns are not correlated with other traditional asset classes like stocks and bonds. The correlation coefficient of returns between S&P Volatility strategy and S&P 500 was 0.28. |