How to interpret MACD as a professional trader
The MACD is a trend deviation indicator using two moving averages. MACD is interpreted by using the signal-line crossovers as buy and sell signals.
The MACD is a trend deviation indicator using two moving averages. MACD is interpreted by using the signal-line crossovers as buy and sell signals.
The MACD is composed using two moving averages. The shorter moving average is subtracted from the longer moving average. The two moving averages are calculated on an exponential basis, where more recent periods are move heavily weighted than in a simple moving average.
The MACD is then smoothed with a third exponential moving average (EMA), which is plotted separately. This average is the signal line, and the crossovers generate buy and sell signals.
MacroVar uses the 21-day moving average as the short-term moving average, the 34-day moving average as the long-term moving average and the 55-day moving average as the signal line. MACD is interpreted by using the signal-line crossovers as buy and sell alerts.
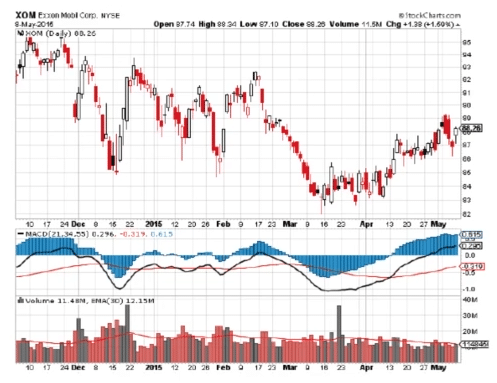
MACD Histogram

The MACD is plotted in a histogram format along with the signal line.