US Biotechnology industry MacroVar Financial Signals
MacroVar algorithms have detected the following signals for US Biotechnology industry. 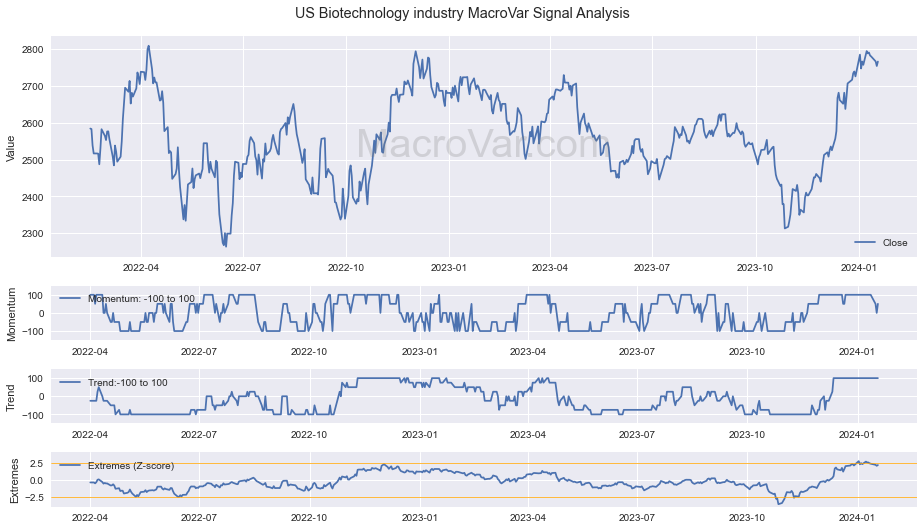
Checkout below the signals related to US Biotechnology industry momentum, trend and exhaustion.
[rml_read_more] Explore below the signals generated today
| Signal Type | Timeframe | Signal | Last | Previous |
|---|---|---|---|---|
| Momentum | Composite | 0.5 | 1.0 |