LIBOR forward curve
MacroVar analyzes the LIBOR forward curve to monitor the market’s expectations for the Federal Reserve’s monetary policy actions (rate hikes/cuts) and its effects on financial markets and the US economic outlook.
The 3-month USD LIBOR forward curve represents the market’s expectation of future fixings derived from trade data of Eurodollar Futures and LIBOR swap rates. The 3-month USD LIBOR forward curve reflects future expectations of Federal Open Market Committee (FOMC) policy.
LIBOR forward curve
| dt | Last Curve | 1 Week ago | 1 month ago |
|---|---|---|---|
| 31-12-23 | 4,67 | 4,55 | 4,10 |
| 31-03-24 | 4,22 | 4,08 | 3,83 |
| 30-06-24 | 3,82 | 3,68 | 3,57 |
| 30-09-24 | 3,52 | 3,39 | 3,38 |
| 31-12-24 | 3,35 | 3,22 | 3,31 |
| 31-03-25 | 3,28 | 3,14 | 3,29 |
| 30-06-25 | 3,25 | 3,11 | 3,32 |
| 30-09-25 | 3,23 | 3,08 | 3,33 |
| 31-12-25 | 3,21 | 3,07 | 3,31 |
| 31-03-26 | 3,22 | 3,08 | 3,32 |
| 30-06-26 | 3,23 | 3,08 | 3,31 |
| 30-09-26 | 3,25 | 3,10 | 3,30 |
| 31-12-26 | 3,26 | 3,11 | 3,27 |
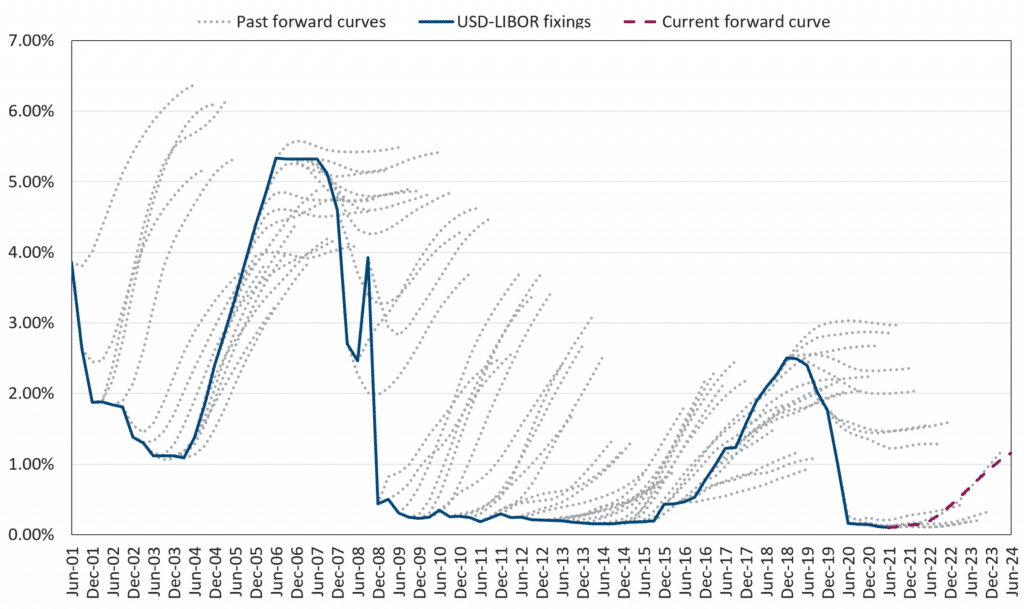
LIBOR forward curve prediction
The chart below presents historical data of LIBOR forward curve over the actual path LIBOR followed. The forward curve has been a very accurate predictor 6-months in advance, of market events.