Demystifying the Dynamics of Current Account: Trends, Impacts, and Forecasts
Current Account definition
The current account is comprised of a country’s exports minus imports, net income from abroad and net current transfers.
A country’s finances are reflected in a simple income statement of revenue and expenses and a simple balance sheet of assets and liabilities. When a country’s revenue, from what one sells, is greater than one’s expenditure, there is positive net income, which leads to one’s assets to rise relative to one’s liabilities (most importantly debt, which raises one’s net savings.
Exports are the main revenue source for countries. Net income is export earnings minus import spending (balance of goods and services) that makes the net income of a country that comes from trading with foreigners.
If one buys more than one sells, he has to finance the difference by some mix of drawing down one’s savings and/or borrowing. one can think of a country’s savings as its foreign-exchange reserves. The United States finances its deficits by running down its reserves/savings and building a lot of debt that is owed to foreigners.
The current account shows the country’s net income which is the country’s exports minus imports, net income from abroad and net current transfers. When the country has a current account deficit it is financed by its exchange rate reserves or increasing debt. The financing is calculated by the country’s capital account.
The Current Account and the Capital Account should be equal.
Current Account Formula
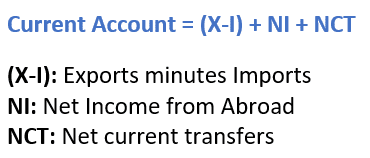
The current account is the sum of the following components:
- Net Exports (Exports minus Imports): the difference between exports and imports is called the trade balance of net exports. A trade deficit is defined when imports are greater than exports. If exports are greater than imports this is called a trade surplus
- Net income from abroad: Net income from abroad is cash flows received from abroad minus cash flows sent aboard. Cash flows can be from: investment income and service transactions
- Net current transfers: Net current transfers include foreign aid and pensions.
The current account shows whether the country’s private and government sectors are increasing or decreasing their claims on foreign wealth. A current account surplus means that the country is providing goods and resources to other economies, and is owed funds in return.
A current account deficit indicates that the country is reducing its holdings of foreign assets and that foreign countries are increasing their claims on the country. The country is consuming or investing more than it is saving. The economy is using resources from other economies to meet its consumption and investment requirements.
Current account deficits are not always bad if the specific country is using the funds efficiently to increase its productivity and increase investment income in the long-term. If however, current account deficits are used to finance consumption then this is problematic.
A current account surplus indicates that a country is increasing its claims on foreign assets.