Multi-factor Models
MacroVar Multi-factor models
MacroVar uses a series of quantitative models to identify potential trading ideas based on statistical anomalies between a specific financial market and it’s related factors. The groups of factors automatically analyzed by MacroVar are:
- Financial Markets and related Macroeconomic Factors (For example: S&P 500 vs US Manufacturing PMI Year on Year)
- Financial Markets vs their related Financial Factors (For example: S&P 500 vs CDX North America Credit Default Swaps)
- Trends
- Momentum
- Inflection points after extended trends
- Extreme Sentiment Indicators based on Commitment of Traders report and other factors
MacroVar Models are open-source, transparent and MacroVar displays these signals in this dashboard, markets webpage and will alert you through MacroVar Newsfeed and Daily newsletter automatically when new signals are generated. You can also access raw data for each financial series including signals from these models by accessing MV database.
Multi-Factor models
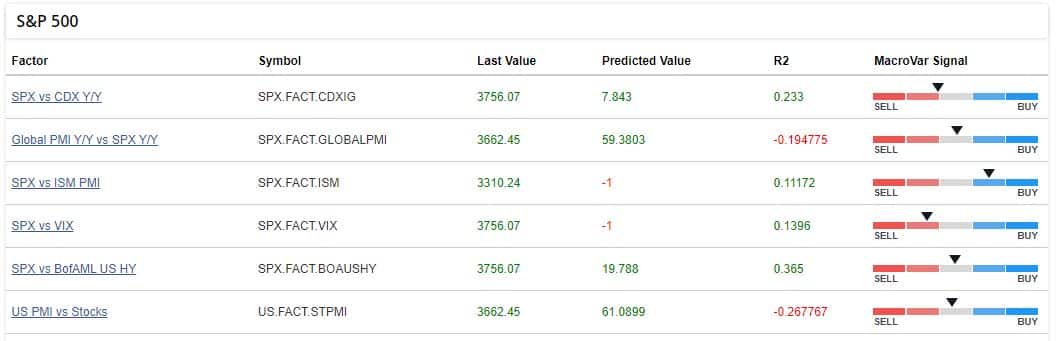
MacroVar analyses macroeconomic and financial factors highly correlated with a specific financial asset. MacroVar models aim to identify divergences in the dynamics between indicators and financial markets which may lead to short-term trading opportunities. A sample of the factors monitored for the S&P 500 are displayed below.
Financial Markets versus Macroeconomic Factors
MacroVar a vast range of macroeconomic factors which are highly correlated with specific financial markets. Some of these factors can be grouped as follows: Stocks vs Manufacturing & Services PMI, Stocks vs ESI, Banking related Stock Sectors vs Yield Curve (KBE vs US 2s10s Yield Curve), Real estate stock sectors vs Macroeconomic Indicators like building permits and mortgage rate levels (ITB ETF vs Building Permits & 30-year mortgage rates), Stock Sectors vs ZEW & ESI sector specific reports

Financial Markets versus market Factors
MacroVar a vast range of financial factors which are highly correlated with specific financial markets. Financial Factors can be grouped as follows: Stocks versus Credit default swaps, Stock Sectors versus and corporate bonds, Stocks vs 10-Year Bond Yields, Commodity related Stock Sectors vs Actual commodities (For Example XLE representing energy companies’ vs crude oil)
Term Structures
MacroVar monitors the term structures of major financial assets used to gauge market expectations like VIX, VSTOXX, SOFR, SONIA, EURIBOR, 3-Month LIBOR, Fed Funds, Eurodollar futures.
The shape and dynamics of the implied curve is used for forecasting financial asset moves.
MacroVar uses quantitative models to monitor trends, momentum and possible inflection points for all financial assets monitored. Our Models are open-source, transparent and MacroVar displays these signals in this dashboard and will alert you through MacroVar Newsfeed and Daily newsletter automatically when new signals are generated. You can also access raw data for each financial series including signals from these models by accessing MV database.
If you are new to investing check our introduction on trends and momentum.
MacroVar index (MV)
The MacroVar index is a synthetic variable derived by a combination of the Momentum, Trend and Bubble models described below. It ranges between -150 and +150. MacroVar displays signals schematically as follows:
The MacroVar index is a synthetic variable derived by a combination of the Momentum, Trend and Bubble models described below. It ranges between -150 and +150. MacroVar displays signals schematically as follows: Value currently 0 meaning that trend is flat.
Value is -25 meaning a strong -ve momentum is currently present.
Value is -50 meaning a strong -ve momentum is currently present.
Value is -75 meaning a strong -ve momentum and long-term is currently present.
Value is -100 meaning a strong -ve momentum and long-term is currently present.
Value is +25 meaning a strong +ve momentum is currently present.
Value is +50 meaning a strong +ve momentum is currently present.
Value is +75 meaning a strong +ve momentum and long-term is currently present.
Value is +100 meaning a strong +ve momentum and long-term is currently present.
Value is either +125 (when Momentum and Trend is +100) or -125 (when Momentum and Trend is -100) meaning that there is a moderate possibility of price reversal from the current trend.
Value is either +150 (when Momentum and Trend is +100) or -150 (when Momentum and Trend is -100) meaning that there is a very high probability of price reversal from the current trend.
MacroVar Momentum Model (M)
Momentum trading is used to capture moves in shorter timeframes than trends. Momentum is the relative change occurring in markets. Relative change is different to a trend. A long-term trend can be up but the short-term momentum of a specific market can be 0.
If a market moves down and then moves up and then moves back down the net relative change in price is 0. That means momentum is 0. A short-term positive momentum, with a long-term downtrend results in markets with no momentum.
MacroVar momentum signal ranges from -100 to +100. The market trend signal is derived as the mean value from 4 calculations for each asset. The timeframes monitored are the following:
- 1 Day (1 trading day)
- 1 Week (5 trading days)
- 1 Month (20 trading days)
- 3 Months (60 trading days)
For each timeframe, the following calculations are performed:
- Calculations of the return for the specific timeframe
- If return calculated is higher than 0, signal value 1 else signal value -1
Finally, the 4 values are aggregated daily.
A technical rollover is identified when MacroVar momentum strength indicator moves from positive to negative value or vice-versa.
Value currently 0 meaning that momentum is flat.
Value is -25 meaning a weak -ve momentum is currently present.
Value is -50 meaning a strong -ve momentum is currently present.
Value is -75 meaning a strong -ve momentum is currently present.
Value is -100 meaning a strong -ve momentum is currently present.
Value is +25 meaning a strong +ve momentum is currently present.
Value is +50 meaning a strong +ve momentum is currently present.
Value is +75 meaning a strong -ve momentum is currently present.
Value is +100 meaning a strong -ve momentum is currently present.
MacroVar Trend model (T)
MacroVar Trend signal ranges from -100 to +100. The market trend signal is derived as the mean value from 8 calculations for each asset. The timeframes monitored are the following:
- 1-month (20 trading days)
- 3-months (60 trading days)
- 6-months (125 trading days)
- 1-year (250 trading days)
For each timeframe, the following calculations are performed:
- Closing price vs moving average (MA): if price greater than MA value is +1, else -1
- Moving average slope: if current MA is higher than previous MA, upward slope +1, else -1
MacroVar trend model can be used as a trend strength indicator. MacroVar trend strength values ranging between +75 and +100 or -75 and -100 show strong trend strength.
A technical rollover is identified when MacroVar trend strength indicator moves from positive to negative value or vice-versa.
Value currently 0 meaning that trend is flat.
Value is -25 meaning a weak -ve trend is currently present.
Value is -50 meaning a strong -ve trend is currently present.
Value is -75 meaning a strong -ve trend is currently present.
Value is -100 meaning a strong -ve trend is currently present.
Value is +25 meaning a strong +ve trend is currently present.
Value is +50 meaning a strong +ve trend is currently present.
Value is +75 meaning a strong -ve trend is currently present.
Value is +100 meaning a strong -ve trend is currently present.
MacroVar Bubble model (B)
MacroVar bubble model monitors a financial asset’s price relative to its 252-day moving average to identify possible inflection point. Extreme moves often followed by price reversals have a high probability of occuring when MacroVar bubble indicator is greater than 2.5 or less than -2.5.
The MacroVar bubble model is calculated using the formula: Latest Price – (252-day Moving Average) / (252-day Standard Deviation). It represents a z-score and extreme values are greater than 2.5 and less than -2.5. Other thresholds include -3, +3.
Value is higher than +2.5 or lower than -2.5 meaning that there is a moderate possibility of price reversal from the current trend.
Value is higher than +3 (when Momentum and Trend is +100) or -3 (when Momentum and Trend is -100) meaning that there is a very high probability of price reversal from the current trend.