Historical Volatility Definition: Understanding the Key Metric in Financial Analysis
Historical Volatility Definition
Historical volatility is calculated as the standard deviation of daily returns of an asset.
To calculate historical volatility, proceed with the following steps:
- Download historical data of the daily closing prices of the financial asset you would like to analyze. Data can be download from MacroVar or other free portals like Yahoo Finance
Image

- If the security has paid any dividends or had any other corporate event like a stock split or other actions affecting its price, you should use the adjusted closing prices.
- Calculate Daily Returns
To calculate the security’s daily returns, you must calculate the logarithmic returns using the natural logarithm (ln) function of Excel. Ln is the ratio of the closing price for a specific day divided by the closing price of the day before.

Copy the formula to the rest of column Daily Returns.
- Calculate the standard deviation of daily returns
Standard deviation is the square root of variance, which is the average squared deviation from the mean.
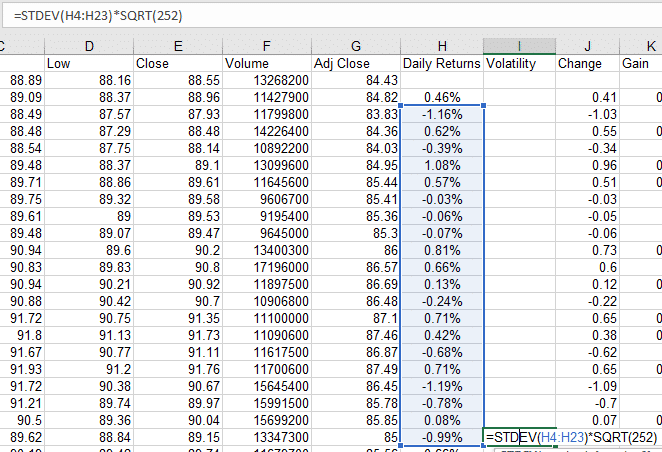
Excel provides a ready to use function for calculating the standard deviation which is the STDEV.

Typically, investors calculate 3 periods of historical volatility: 1. Monthly historical volatility (20 days), 2. Quarterly historical volatility (60 days) and 3. Annual historical volatility (252 which is the number of trading days in a year).
- Calculate the annualized historical volatility
So far we calculated the historical volatility of the financial asset under examination based on 1-day historical volatility since we used the daily returns. Our last step, is to convert the 1-day volatility to the annualized volatility which is very useful for comparing volatilities of different assets, markets or funds.
Annualized volatility is calculated by multiplying the daily volatility by the square root of the number of trading days per years which is 252.
If we had calculated weekly historical volatility using weekly returns, we could calculate annualized volatility by the square root of the number of trading weeks per year which is 52.
The formula we will use is: Cell of Daily Volatility * SQRT(252). Other more precise forward looking volatility metrics is implied volatility of an asset.
Historical Volatility Excel
Use MacroVar excel below to calculate historical volatility using Excel.
Sign up free to download MacroVar Historical Volatility Excel for free and access historical volatility and other statistics for more than 1000 financial markets.