Understanding the 3 market trends
Market trends definition
There are three price trends that are simultaneously active in any market: the short-term trend which lasts from days to weeks, the medium-term trend which lasts from weeks to months and the long-term trend which lasts from months to years. All three trends are active all the time and may be moving in opposite directions.
Traders focus on the intraday and short-term trend varying from minutes to weeks. Speculators focus on the medium-term trend holding market positions for a period of weeks to months. Investors focus for the long-term trend holding positions from months to years.
The long-term trend is the most important trend and the easiest to identify. It is of primary concern to the investor. The medium-term can move with the long-term trend or against it. If the medium-term trend retraces significantly, it is characterized as a correction. The characteristics of a technical correction must be rigorously evaluated to avoid confusing it with a change in the long-term trend.
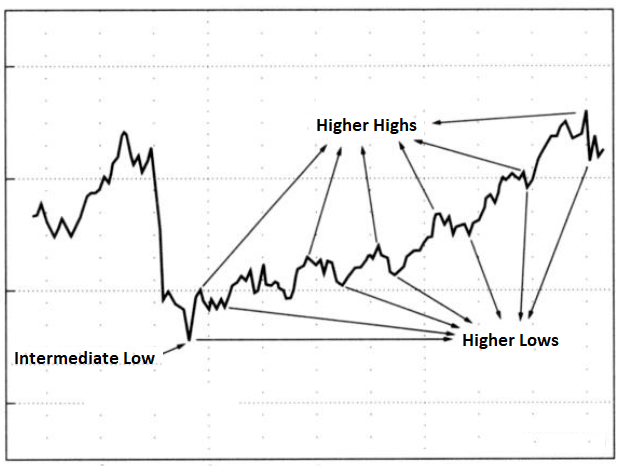
Upward market trend
An upward market trend is a long-term move with a series of higher highs and higher lows.
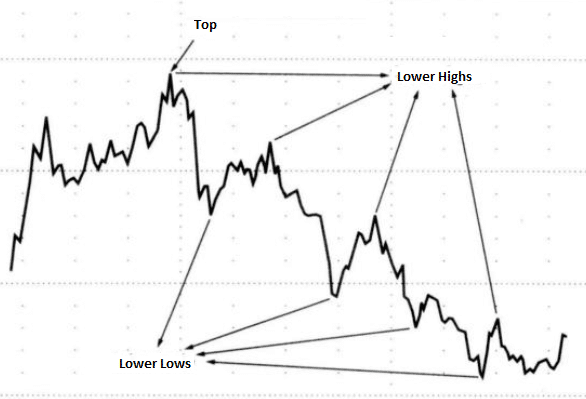
Downward market trend
A downward market trend is a long-term price movement consisting of a series of lower lows and lower highs.
Market trends are long-term in nature last from weeks to months.
MacroVar Market trends model
MacroVar Trend signal ranges from -100 to +100. The market trend signal is derived as the mean value from 8 calculations for each asset. The timeframes monitored are the following:
- 1-month (20 trading days)
- 3-months (60 trading days)
- 6-months (125 trading days)
- 1-year (250 trading days)
For each timeframe, the following calculations are performed:
- Closing price vs moving average (MA): if price greater than MA value is +1, else -1
- Moving average slope: if current MA is higher than previous MA, upward slope +1, else -1
MacroVar trend model can be used as a trend strength indicator. MacroVar trend strength values ranging between +75 and +100 or -75 and -100 show strong trend strength.
A technical rollover is identified when MacroVar trend strength indicator moves from positive to negative value or vice-versa.