How to invest money
This guide explains how to invest money yourself, analyze any potential investment, trade yourself and not be misguided by financial advisors. Select from the options below:
Steady Wealth Growth & Winning by not losing
To build your wealth in a short time period requires huge risks and the odds of succeeding are minimal. Most successful investors build their wealth gradually, by selecting investments which generate good returns with low risk. Your partner in building wealth is compound interest.
Compound interest is interest calculated on the initial principal and also on the accumulated interest of previous periods of a deposit. Compound interest can be thought of as “interest on interest”.
Compounding needs two prerequisites to work:
- Investing for long periods of time
- Never lose big amounts of money

If you invest $10,000 at 20 with a 10% yearly average rate of return in 45 years you will have $728,904. The reason is that in first year your $10K would become $11K, while during second year your $11K would grow up by 10% and you will earn interest on the principal ($10K) and the interest ($1K) of the previous year. Additionally, If you save $10,000 every year for 45 years, then you will end up with $6,526,425.
When to Stay out of the Markets
The most important investment decision is when to stay out of the markets that is hold mostly cash or other safe investments like low-risk government bonds. The reason is, it is very difficult to recover from big losses during bear markets (the US Stock Market lost 38% on average).
Tip: A 50% loss requires a 100% gain to get back to even.
In the example below, experiencing three big annual losses adversely affected compounding and as a result the end value of the portfolio. More specifically, an investment of $10,000 grew to $1,8 million after 40 years instead of $24 million because of three 50% losses experienced in years 12, 24 and 36.

Systematic Investing
You should ignore stock tips, emotion, market headlines & economic forecasts. Instead, you should base your investment decisions on systematic flexible methods, build on scientific analysis and objective criteria, which adapt to the current market conditions.
Tip: Remain faithful to your investment strategy through good and bad times. Do not let your ego involved in market view.
Diversification
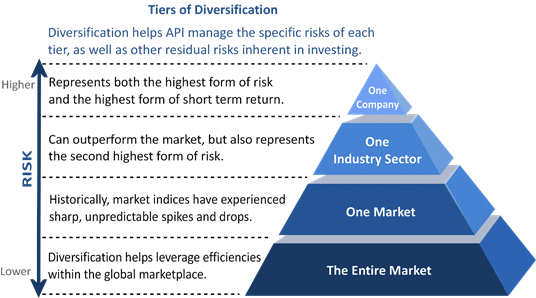
The key investment principle to achieve good investment returns with low risk is diversification.

Individual assets have hidden big risks that amateur investors won’t recognize (e.g. Enron, Lehman Brothers collapses, General Motors Bankruptcy).
A well-conceived diversified dynamic portfolio of assets has the potential to perform much better than investing individually in the assets themselves only.
Risk Management
Investors should select investments and strategies which control losses and cut them short while let profits run. If losses versus profits are small an investor can be 60% of time wrong and still be profitable.
Assets & the 4 Economic Environments
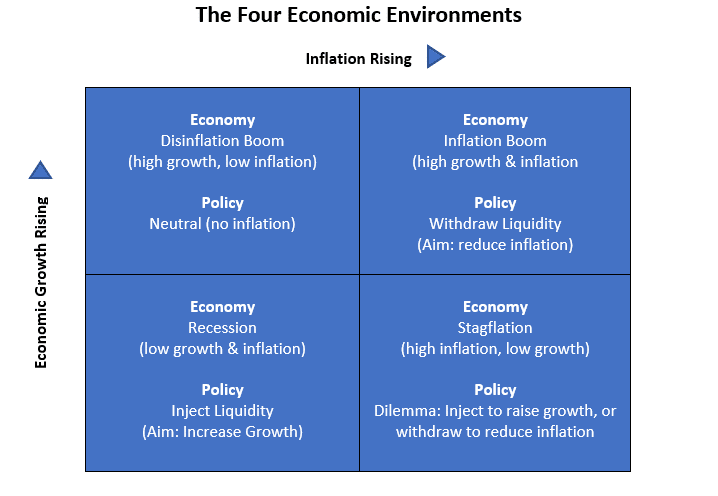
The global economy status is best described by 2 combined variables: inflation and economic growth.

There are four economic environments:
- Inflationary boom: Accelerating Economic growth with Rising inflation
During this economic environment, the best performers are emerging market stocks, international real estate, emerging countries’ currencies, commodities, and TIPS (treasury inflation protected securities). The worst performers are US treasury bonds and cash since they are adversely affected by rising inflation.
High global growth with rising inflation expectations lifts commodities. Many emerging economies growth is linked to commodities. When commodities rise emerging market stocks, currencies and real estate rise as well.
- Stagflation: Slowing Economic Growth with Rising Inflation
The best asset performers protecting investors from inflation are Gold, Cash, Treasury Inflation Protected securities and the US Dollar. The worst performers are long-duration treasury bonds adversely affected by rising inflation.
- Disinflationary boom: Accelerating Economic growth with Slowing Inflation
The best performers are developed markets stocks, developed Real estate and US Treasury bonds.
Low inflation with moderate growth is a good environment for bonds and stocks and bad for the worst performs which are commodities and commodity related sectors.
- Deflationary Bust: Slowing Economic Growth with Falling Inflation
During this environment, the best asset performers are Long-Duration Treasuries and Cash. Everything else experiences big volatility and often large losses.
During crashes and economic depressions bonds rise while stocks and commodities fall. Investors during these environments look for the safety of their asset rushing into the safety of US treasury bonds and the US dollar while selling stocks and commodities.
Discretionary vs Systematic Investing
There are two types of investment approaches: discretionary investing and systematic investing.
Discretionary investing relies on the subjective judgement of investors. It is in the investor’s discretion to decide which market to trade, when to trade, and how much to risk.
Systematic investing relies solely on signals produced by data analysis. Signals are generated from pattern recognition of market data and/or fundamental analysis of economic and corporate data.
If you are planning to invest in a specific mutual fund, index fund, ETF or any other investment check our investing for beginners guide to explore what to calculate for each investment to make sure you avoid excessive risks and generate stable good annualized returns.
If you are interested in becoming a trader yourself and learn how to trade stocks, bonds, commodities and currencies check our guides on portfolio management, stock trading, bonds investing, currency trading.
Investing for Beginners
If you are a beginner in investing our investing basics guide below will help you grasp the most important principles of investing to general long-term wealth creation. Moreover, you will learn how to invest in mutual funds, index funds, stocks, bonds, commodities, and currencies.
The most important mistake amateur investors make is they select investments based only on their past short-term returns while ignoring the volatility of returns.
Investors should select investments with high average returns and low volatility.
To examine an investment’s performance, you must analyse the following characteristics:
- Average Annual returns: Average annual return (AAR) is the percentage historical return of an investment. Typical Fund average returns are 5-10%.
- Volatility: Volatility describes the degree to which an investment’s value moves up and down. This is the investment’s risk.
Investors should select investments with the highest return possible and the lowest volatility.

Conclusion: Balanced Portfolio generated 10% average returns with 5% risk as compared to the US stock market which generated 5% with twice the risk
If an investment has an average annual return of 10% and a volatility of 15%, investors should expect annual returns to fall within a range of 5% to 25%.
- Maximum Drawdown: An asset or investment strategy suffers a drawdown when it loses money. Maximum drawdown measures the largest single drop from peak to bottom in the investment’s value. Investors in a fund with a max drawdown of 50% saw their portfolios lose half of their value.
Investors should select investments with the lowest possible maximum drawdown. Investments with Maximum Drawdown between 5% and 20% are considered safe investments.
- Performance Consistency: An investment’s performance should be examined for long historical periods of at least 10 years to confirm how an investment performed during different market environments (Growth, Recession).
Market crashes: Special attention must be given on how the investment performed during market crisis like 2000 dot-com bubble, 2008-2009 crash etc.
Longer periods of historical performance often guarantee similar future investment performance irrespective of the market environment.
- Sharpe Ratio: Sharpe ratio helps investor understand the return an investment compared to its risk. Good safe investment strategies generate Sharpe ratios between 1.0 and 2.0.
- Investment Costs: An investment’s net performance must be examined after all costs have been deducted. The higher the cost of an investment, the greater the erosion of an investor’s returns is and hence the more difficult it is to generate profits.
Mutual funds embed their costs into what investors see as their net performance.
Financial advisors charge a flat financial advisor fee covering the whole advisory, which is generally based on a percentage of assets under management (AUM). Common values are between 1-2% of AUM.
Investors in individual securities (stocks, ETFs etc.) pay commissions for trade execution. When analysing a specific strategy, it is critical to examine the total trading costs. The 2 major variables to check are 1. The frequency of trading and 2. The cost per trade (typically $5-10).
How to invest in mutual funds
There are thousands of mutual funds available for investing in different sectors, investment styles, and asset classes.
Our checklist below on how to invest in mutual funds presents the hidden risks you should avoid when investing in any mutual fund and how to select the best mutual fund based on objective investment criteria and metrics.
Before investing in a specific mutual fund you must examine thoroughly it’s performance using the following step by step guide:
Step 1: Examine the mutual fund’s Annual Returns: Average annual return (AAR) is the percentage historical return of an investment. The annualized return must be examined for long historical periods of at least 10 years to confirm how an investment performed during different market environments (Economic Growth, Recessions).

Step 2: Examine the mutual fund’s sharpe Ratio
The sharpe ratio helps you understand the return of a mutual fund compared to its risk. Sharpe ratio is the ratio of the average return earned per unit of volatility experienced. If you want to learn more about examining the mutual fund’s risk click here on how to calculate it’s historical volatility.
Well performing safe mutual funds have sharpe ratios between 1.0 and 2.0. In this example, the fund’s Sharpe ratio for the period 2006 – 2014 is 1.60 which is considered excellent.
Step 3. Examine the mutual fund’s Maximum Drawdown
A mutual fund suffers a drawdown when it loses money. Maximum drawdown measures the largest single drop from peak to bottom in the mutual fund’s value. Investors in a mutual fund with a max drawdown of 50% saw their portfolios lose half of their value.
You should ask yourself, realistically, how deep a drawdown will you be able to tolerate and not liquidate your mutual fund? Would it be 20 percent or 10 percent? Comparing your tolerance with the numbers obtained from the mutual fund’s historical performance determines whether that mutual fund is for you.
The fund’s Maximum Drawdown for the period 2006-2015 is -13.30% which is considered excellent. The fund during the financial crisis of 2008-09 only lost 13.30% compared to the US Stock Market represented by the S&P 500 which lost 53% (S&P Peaked in October 2007 & bottomed in March 2009)
Investors should select mutual funds with the lowest possible maximum drawdown. Mutual funds with Maximum Drawdown between 5% and 20% are considered safe investments.
Step 4: Comparing Mutual Funds performance
Before investing in a mutual fund, you should compare it’s historical performance with benchmarks like the US stock market index (S&P 500), mutual fund indexes and other mutual funds. You should compare the mutual fund’s sharpe ratio and not just it’s annual performance to get an overview of the risk return mutual fund profile.

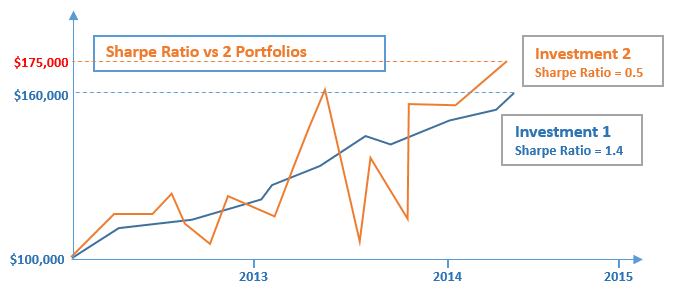
Assume you had to choose between two mutual funds with the mutual fund performance displayed above. Although mutual fund 2 has a higher ending value than mutual fund 1, it has a much higher volatility and drawdown than mutual fund 1. As a result, mutual fund’s 1 sharpe ratio is 3 times higher than mutual fund’s 2 sharpe ratio and hence for low risk investors mutual fund 1 is preferred.
In the example above, during the second half of 2013, mutual fund 2 dropped from $160,000 to $105,000 losing 35% of its value. On the other hand, mutual fund 1 biggest drawdown occurred in end of 2013 losing just 4.5% of its value.
Step 5. Mutual Fund fees
Before investing in a mutual fund ask for the mutual fund fees applied
Step 6. Gather or request the mutual fund’s historical performance
The first step is to download from the web or request from the mutual fund provider the historical monthly returns of the mutual fund for the largest historical period available. You need this information to examine the mutual fund’s performance during bull and bear markets and economic recessions.
You should consider investing only in mutual funds with historical performance data of more than 10 years including preferably periods of recession and bear markets like the current Covid-19 pandemic crisis and the Global financial crisis of 2008. Special attention must be given to the mutual fund’s performance during economic recessions and bear markets where the probability of losing funds is high.
The fund’s net performance must be analyzed after deducting fees.
In the example below, historical monthly returns for the mutual fund span from 2006 to 2015 which is an acceptable historical period to examine.
In this example, the mutual fund’s worst year was in 2008 when the fund lost 2.91% only and the worst monthly return was 5% which is acceptable.

Investment Strategies
There are two types of investment approaches: discretionary investing and systematic investing.
The Systematic approach relies solely on signals produced by data analysis. Signals are generated from pattern recognition of market data and/or fundamental analysis of economic and corporate data.
The discretionary approach relies on the subjective judgement of investor. It is in the investor’s discretion to decide which market to trade, when to trade, and how much to risk.
Investors often follow a hybrid approach either following a systematic approach with a discretionary overlay or a discretionary approach with a systematic signal generation overlay.
Investors should analyse any investment or investment strategy or fund by using the investment criteria discussed above.
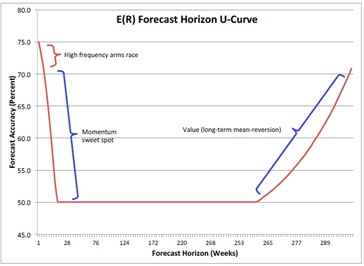
An investment strategy has a timeframe on which it operates and exploits market anomalies to capture profits. Timeframes can range from milliseconds to years.

High-Frequency Trading Strategies operate in a short-term horizon ranging from intraday (microseconds) to several days. They exploit structural effects in the marketplace, statistical relationships between financial instruments or information flow. They use big leverage which can often be very risky, and their success is dependent on market microstructure inefficiencies which decay fast over time removing opportunities for profit.
Mean Reversion strategies operate in the short to medium-term horizons and they exploit the mean reverting behaviour of some financial instruments under special conditions. The theory suggests that prices move back towards the mean or average. Statistical stationarity and cointegration are key principles to determine the mean reversion likelihood of prices of financial instruments.
Momentum Investing Strategies operate in the medium-term horizon ranging from weeks to several months and they exploit the momentum structural anomaly.
Momentum is caused by human behaviour who usually choose to follow the crowd rather than act against it. As a result, investments keep moving in the same direction for several weeks as rising prices attract buyers while falling prices attract sellers. Academic research has shown momentum to be a valid strategy from the early 1800s up to the present and across nearly all asset classes.
Value Investing Strategies look for stocks with strong fundamentals including earnings, dividends, book value and cash flow selling at bargain prices relative to their true value (quality). The value investor seeks to find stocks of undervalued companies having the potential to increase when the market recognizes the stock’s true value.
The big drawback of value investing strategies is their long-term horizon and their inconsistency of returns, which leads most value strategies to generate low sharpe-ratios (less than 1), big maximum drawdowns and high risk
If you are interested in becoming a trader yourself and learn how to trade stocks, bonds, commodities and currencies check our free Professional trading course below.
Instead of paying fees to mutual funds, you can develop your own investment strategy using our free asset allocation guide. You can also use our free guide on trading & investing. Alternatively, you can access our investment strategies section to research and implement strategies of different trading styles.