How to invest in mutual funds
There are thousands of mutual funds available for investing in different sectors, investment styles, and asset classes.
Our checklist below on how to invest in mutual funds presents the hidden risks you should avoid when investing in any mutual fund and how to select the best mutual fund based on objective investment criteria and metrics.
Before investing in a specific mutual fund you must examine thoroughly it’s performance using the following step by step guide:
Step 1: Examine the mutual fund’s Annual Returns
Average annual return (AAR) is the percentage historical return of an investment. The annualized return must be examined for long historical periods of at least 10 years to confirm how an investment performed during different market environments (Economic Growth, Recessions).

Step 2: Examine the mutual fund’s sharpe Ratio
The sharpe ratio helps you understand the return of a mutual fund compared to its risk. Sharpe ratio is the ratio of the average return earned per unit of volatility experienced. If you want to learn more about examining the mutual fund’s risk click here on how to calculate it’s historical volatility.
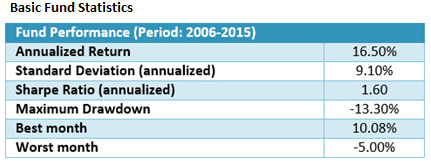
Well performing safe mutual funds have sharpe ratios between 1.0 and 2.0. In this example, the fund’s Sharpe ratio for the period 2006 – 2014 is 1.60 which is considered excellent.
Step 3. Examine the mutual fund’s Maximum Drawdown
A mutual fund suffers a drawdown when it loses money. Maximum drawdown measures the largest single drop from peak to bottom in the mutual fund’s value. Investors in a mutual fund with a max drawdown of 50% saw their portfolios lose half of their value.
You should ask yourself, realistically, how deep a drawdown will you be able to tolerate and not liquidate your mutual fund? Would it be 20 percent or 10 percent? Comparing your tolerance with the numbers obtained from the mutual fund’s historical performance determines whether that mutual fund is for you.
The fund’s Maximum Drawdown for the period 2006-2015 is -13.30% which is considered excellent. The fund during the financial crisis of 2008-09 only lost 13.30% compared to the US Stock Market represented by the S&P 500 which lost 53% (S&P Peaked in October 2007 & bottomed in March 2009)
Investors should select mutual funds with the lowest possible maximum drawdown. Mutual funds with Maximum Drawdown between 5% and 20% are considered safe investments.
Step 4: Comparing Mutual Funds performance
Before investing in a mutual fund, you should compare it’s historical performance with benchmarks like the US stock market index (S&P 500), mutual fund indexes and other mutual funds. You should compare the mutual fund’s sharpe ratio and not just it’s annual performance to get an overview of the risk return mutual fund profile.

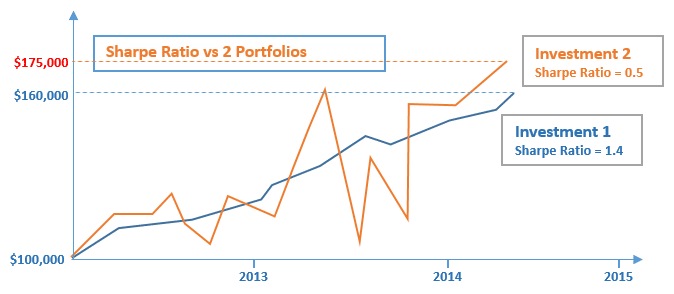
Assume you had to choose between two mutual funds with the mutual fund performance displayed above. Although mutual fund 2 has a higher ending value than mutual fund 1, it has a much higher volatility and drawdown than mutual fund 1. As a result, mutual fund’s 1 sharpe ratio is 3 times higher than mutual fund’s 2 sharpe ratio and hence for low risk investors mutual fund 1 is preferred.
In the example above, during the second half of 2013, mutual fund 2 dropped from $160,000 to $105,000 losing 35% of its value. On the other hand, mutual fund 1 biggest drawdown occurred in end of 2013 losing just 4.5% of its value.
Step 5. Mutual Fund fees
Before investing in a mutual fund ask for the mutual fund fees applied.
Step 5. Gather or request the mutual fund’s historical performance
The first step is to download from the web or request from the mutual fund provider the historical monthly returns of the mutual fund for the largest historical period available. You need this information to examine the mutual fund’s performance during bull and bear markets and economic recessions.
You should consider investing only in mutual funds with historical performance data of more than 10 years including preferably periods of recession and bear markets like the current Covid-19 pandemic crisis and the Global financial crisis of 2008. Special attention must be given to the mutual fund’s performance during economic recessions and bear markets where the probability of losing funds is high.
The fund’s net performance must be analyzed after deducting fees.
In the example below, historical monthly returns for the mutual fund span from 2006 to 2015 which is an acceptable historical period to examine.
In this example, the mutual fund’s worst year was in 2008 when the fund lost 2.91% only and the worst monthly return was 5% which is acceptable.

Instead of paying fees to mutual funds, you can develop your own investment strategy using our free asset allocation guide. You can also use our free guide on trading & investing.
Investment Strategies
You can access our investment strategies section to research and implement strategies of different trading styles.