Unlocking Investment Success: The Power of Portfolio Theory
Professional Portfolio Management requires a systematic investment process to achieve the following targets:
| Protect capital by controlling the portfolio’s risk (hedged portfolio) |
| Generate Consistent & Smooth compounded risk-adjusted returns irrespective of the general market trend |
There are different investment strategies to achieve this either systematic (using software mdoels) or discretionary. Irrespective of the investment strategy followed, any investment strategy should be based on the following core principles.
Professional Portfolio Management
Professional traders manage a portfolio based on the following criteria:
| Their portfolio consists of Long/Short positions with 1-3 months under normal market volatility conditions. Their trading ideas are formed using 70% fundamental analysis and 30% Price Dynamics models. |
| Their portfolio consists of 20-30 uncorrelated positions with position limits ranging from 1% to 3% size. |
| Their aim is to generate consistently high risk-adjusted returns. For example: Portfolio returns 15%, 10% annualized volatility and a maximum drawdown of maximum 10%. |
High diversification reduces the portfolio’s volatility, hence increases the portfolio’s risk-adjusted return and sharpe ratio.
This is Ray Dalio’s holy grail of investing.
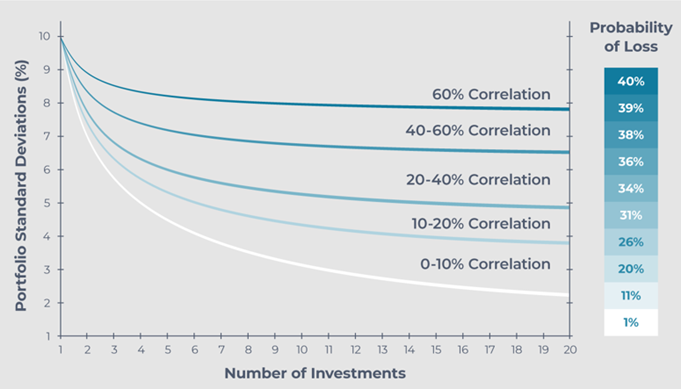
Overdiversification issues
As can be seen on the chart above a few positions greater than 10-15 has a very low effect on lowering the portfolio further. Given that it is difficult to identify more than 10-15 trading ideas (based on fundamental & timing factors) at any given time adding low-correlation ideas to a portfolio for the sake of diversification often leads to lower returns.
Correlation definition
Correlation refers to a statistical measure that quantifies the degree of association or relationship between two or more variables. It indicates how changes in one variable are related to changes in another variable. Correlation does not imply causation, meaning that just because two variables are correlated does not necessarily mean that changes in one variable cause changes in the other.
There are different types of correlation coefficients that can be used to measure the strength and direction of the relationship between variables:
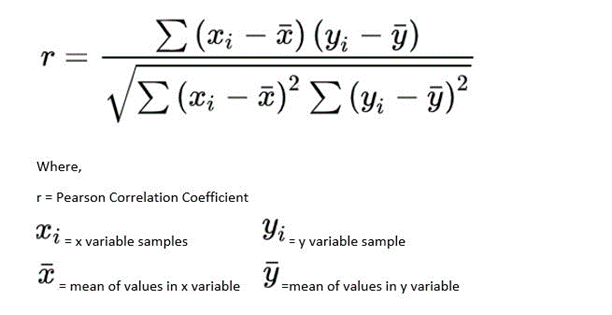
1. Pearson Correlation Coefficient (Pearson’s r): This is the most common type of correlation coefficient, and it measures the linear relationship between two continuous variables. It ranges from -1 to +1. A positive value indicates a positive linear relationship, a negative value indicates a negative linear relationship, and a value close to 0 indicates a weak or no linear relationship.
2. Spearman Rank Correlation Coefficient: This correlation coefficient is used when the variables are not necessarily continuous and linearly related. It assesses the strength and direction of the monotonic relationship between two variables. It is based on the ranks of the data rather than the actual values.
Correlation coefficients provide valuable insights into how variables interact and can help researchers and analysts understand patterns and trends in data. However, it’s important to note that correlation does not provide information about causation; additional research and analysis are needed to establish causal relationships between variables.
MacroVar uses Pearson coefficient of correlation
Correlations are not static and undergo changes over time
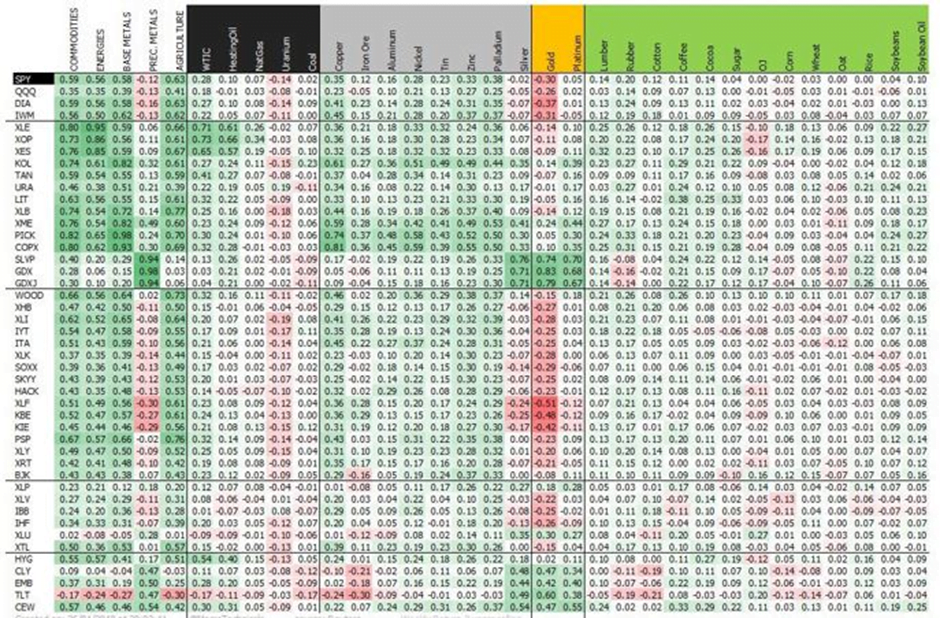
Traders must monitor the rolling correlation of each trading idea or position versus the rest of the portfolio aiming to keep it low.
MacroVar calculates 60-day rolling correlation between financial assets to monitor correlations.
Correlation during high Market Risk
Correlations reach a peak of +1 during crises. This eliminates the diversification effect which keeps a portfolio’s volatility low.
Special attention should be given to identify upcoming increased volatility because portfolio volatility is hit by two factors:
- Individual assets volatility rises
- Correlations between positions rise diminishing diversification effects
Portfolio correlation
Portfolio volatility is affected by two factors:
- The volatility of portfolio’s assets
- The correlation between assets
As long as the correlation between those assets is less than 1, the portfolio’s volatility falls significantly the more positions the trade adds albeit at a diminishing rate.
For small portfolios (1-5 positions), the volatility of those individual assets becomes paramount—given their substantial influence on the overall profit or loss of the portfolio.
For larger portfolio (8-15 positions), the inter-asset correlation holds greater significance than individual volatilities.
Hence, the notion of indiscriminately augmenting portfolio positions solely for diversification’s sake is not prudent. Here are two reasons why:
The incremental reduction in portfolio risk beyond the threshold of 8 to 15 positions is insignificant while the quality of trade ideas diminishes. Hence the expected return of the portfolio diminishes.