The Importance of Financial Planning and How to Do It Right
Financial planning is the analysis of a person’s current financial situation and the design of a financial plan to generate long-term income by investing.
Investors want to achieve a sustainable income during their lifetimes by investing their savings.
Markets are uncertain and we do not know what the future holds (In a 20-year investment horizon, stocks have delivered total returns ranging from 2% to 18% per year). Investors should not trust advisors promising precise outcomes on their investments over long uncertain periods.
Instead, smart investors choose investment strategies and assets which generate consistent returns with low volatility under most economic and market environments.
The most important factors affecting the sustainable income investors strive to achieve are 1. Investments’ volatility, 2. Sequence of returns risk and 3. Inflation.
High investment volatility, adverse sequence of returns and high inflation can destroy your wealth and your retirement income. All three risk factors can be mitigated by selecting low-volatility investment strategies.
Compounding = Wealth Creation
To build your wealth in a short time period requires huge risks and the odds of succeeding are minimal. Most successful investors build their wealth gradually, by selecting investments which generate good returns with low risk. Your partner in building wealth is compound interest.
“Compound interest is the eighth wonder of the world.” – Albert Einstein
Compound interest is interest calculated on the initial principal and also on the accumulated interest of previous periods of a deposit. Compound interest can be thought of as “interest on interest”.
Click to Discover the power of Compounding: image 8 How $X grows to $Y in X years
Compounding needs two prerequisites to work:
- Investing for long periods of time
- Never lose big amounts of money

If you invest $10,000 at 20 with a 10% yearly average rate of return in 45 years you will have $728,904. The reason is that in first year your $10K would become $11K, while during second year your $11K would grow up by 10% and you will earn interest on the principal ($10K) and the interest ($1K) of the previous year. Additionally, If you save $10,000 every year for 45 years, then you will end up with $6,526,425.
When to Stay out of the Markets
The most important investment decision is when to stay out of the markets that is hold mostly cash or other safe investments like low-risk government bonds. The reason is, it is very difficult to recover from big losses during bear markets (the US Stock Market lost 38% on average).
Tip: A 50% loss requires a 100% gain to get back to even.
In the example below, experiencing three big annual losses adversely affected compounding and as a result the end value of the portfolio. More specifically, an investment of $10,000 grew to $1,8 million after 40 years instead of $24 million because of three 50% losses experienced in years 12, 24 and 36.

Portfolio Volatility: the most important factor defining your retirement income
The volatility of an investment is the most important thing defining its growth. High volatility destroys an individual’s investment portfolio and as a result his future retirement income.
Investment volatility risk is mitigated by investing in low volatility with consistent returns investments.
Example 1:
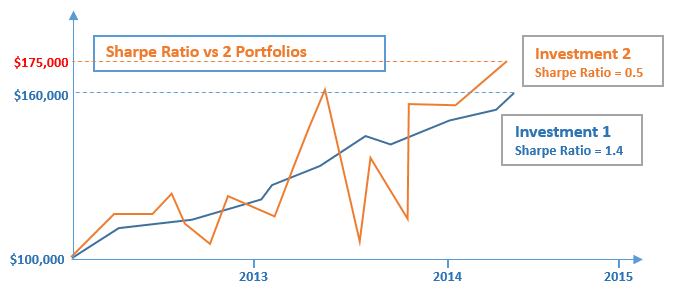
Assume you had to choose between two investment portfolios with the historical return performance displayed above. Although portfolio 2 has a higher ending value than portfolio 1, it has a much higher volatility and drawdown than portfolio 1. As a result, portfolio 1 sharpe ratio is 3 times higher than portfolio 2 sharpe ratio and hence portfolio 1 is preferred.
In the example above, during the second half of 2013, portfolio 2 dropped from $160,000 to $105,000 losing 35% of its value. On the other hand, portfolio 1 biggest drawdown occurred in end of 2013 losing just 4.5% of its value.
Example 2:
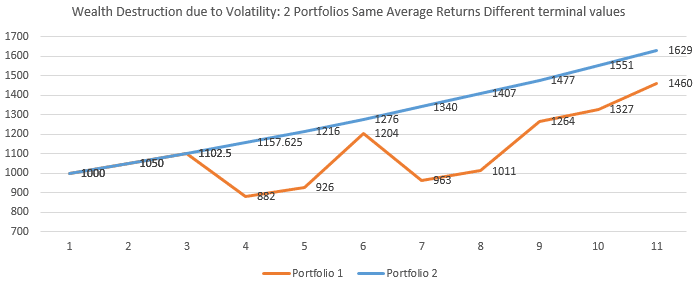
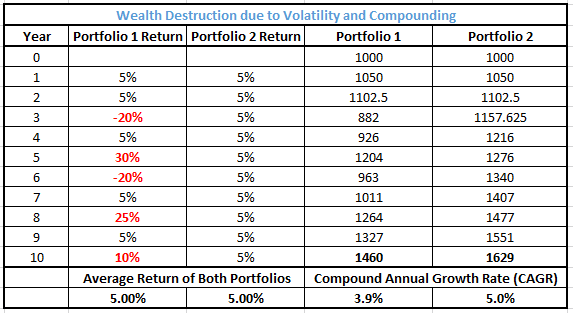
The compound annual growth rate of portfolio 1 is 3.9% having lost almost one fourth versus CAGR of portfolio 2. The reason is that big drops in an investment’s hurt the compound growth of the portfolio. In year 3 portfolio’s 1 value falls from $1102 to $882 and it’s very difficult for the portfolio to recover the loss as seen on the chart.
Sequence of Returns Risk
Sequence risk is the risk of receiving negative returns early or late in a period of withdrawals or savings from an individual’s investments. Sequence risk is mitigated by investing in low-volatility with consistent returns investments.
There are 2 types of sequence risk.
Saver’s Sequence risk is the risk an individual faces of losing wealth by receiving negative returns late during the period he saves to build his wealth.
Retiree’s sequence risk is the risk an individual faces of losing wealth by receiving negative returns early during a period when withdrawals are made to sustain his retirement income.
Saver’s sequence risk
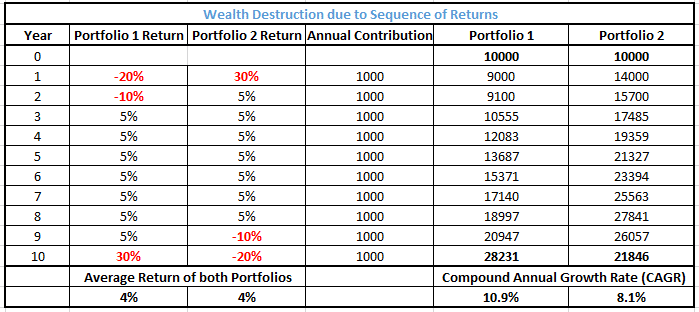
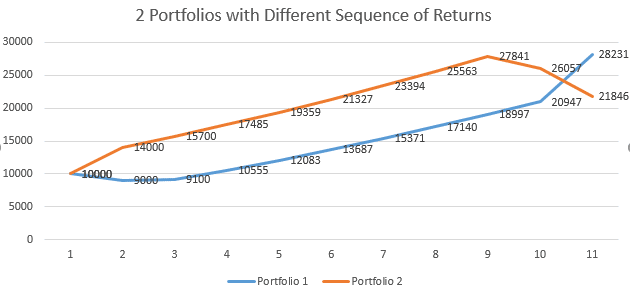
There are 2 portfolios of a saver who annually contributes $1000 to both portfolios. Both portfolios have the same average return (4%) but different sequence of returns. Portfolio 1 experiences big losses during early years while portfolio 2 experiences the same losses late in portfolio’s life. As a result, portfolio 1 ends up after 10 years at $28231 versus portfolio 2 which ends up at $21846 having gained 29% versus portfolio 2.
The compound growth rate (definition: compound annual growth rate (CAGR) is the mean annual growth rate of an investment over a specified period of time) of portfolio 1 is 10.9% having gained almost one fourth versus CAGR of portfolio 2.
The reason is that losing 20% of $11000 (early stages of portfolio) hurts the portfolio much less than losing 20% of $27000 (late stages of portfolio).
Retiree’s sequence risk
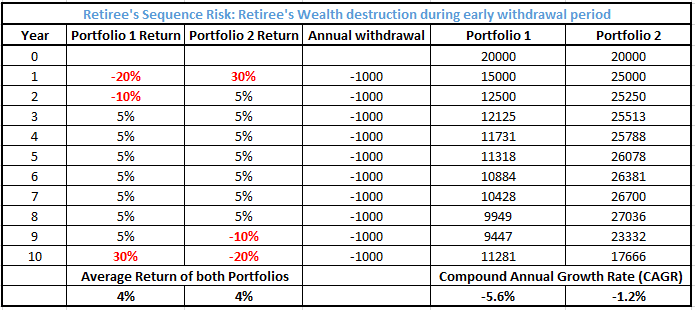
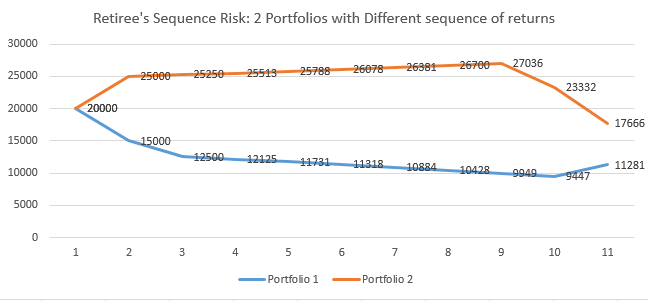
There are 2 portfolios of a saver who annually withdraw $1000 from both portfolios. Both portfolios have the same average return (4%) but different sequence of returns. Portfolio 1 experiences big losses during early years while portfolio 2 experiences the same losses late in portfolio’s life. As a result, portfolio 1 ends up after 10 years at $11281 versus portfolio 2 which ends up at $17666 having gained 36% versus portfolio 2.
The compound growth rate (definition: compound annual growth rate (CAGR) is the mean annual growth rate of an investment over a specified period of time) of portfolio 1 is -5.6% having lost almost 5 times what portfolio 2 has lost.
The reason is that big drops in a portfolio’s early life hurts its compound growth. In year 1 portfolio’s 1 value falls from $20000 to $15000 and it’s very difficult for the portfolio to recover the loss during year 3-9 where 5% annual returns are generated.
Safe withdrawal rate
Retired Investors care about their safe withdrawal rate (SWR). Safe Withdrawal Rate is simply the rate that you can withdraw from your portfolio every year that ensures you have a high probability of never running out of money.
A typical SWR is 4% per year (inflation-adjusted) which according is often recommended for 30-year retirements. A couple who needs $100,000 pretax and after inflation per year to fund their lifestyle with a 4% SWR means that they would need $2,500,000 in savings.
SWR is affected by the years of retirement (affected by 1. Age of retirement and 2. living longer than expected risk) and poor investment returns generated over the investment horizon and inflation.
Every asset allocation, even 100% US Treasuries bonds has supported a 3% SWR adjusted for inflation. However, current interest rates of 1.5-1.8% are lower than they have been historically. Therefore, investors with 100% bond positions are unlikely to retire successfully with 3% SWR.
For retirees having an SWR of 3.5% to 5.5% the optimal mix historically has been stocks/bonds is 70/30.
However, the calculations above are based on historical information. Given however, current market valuations (Shiller PE), dividend yields and current interest rates quantitative models (Pfau 2013) suggest SWRs in the range of 2%.
MacroVar Asset Allocation strategies prove that the poor investment returns factor can be omitted from the problem since there is high chance of generating high returns with low risk, hence low probability of poor investment returns.
If you are planning to invest in a specific mutual fund, index fund, ETF or any other investment check our investing for beginners guide to explore what to calculate for each investment to make sure you avoid excessive risks and generate stable good annualized returns.
If you are interested in becoming a trader yourself and learn how to trade stocks, bonds, commodities and currencies check our guides on stock trading, bonds investing, currency trading and options trading.
Alternatively, if you are interested in structuring your systematic low-risk investment strategy yourself without relying on financial advisors and investment firms check our asset allocation guide.
Sign up for MacroVar analytics for Free
Get your robo financial planner by using MacroVar analytics & tools for free.