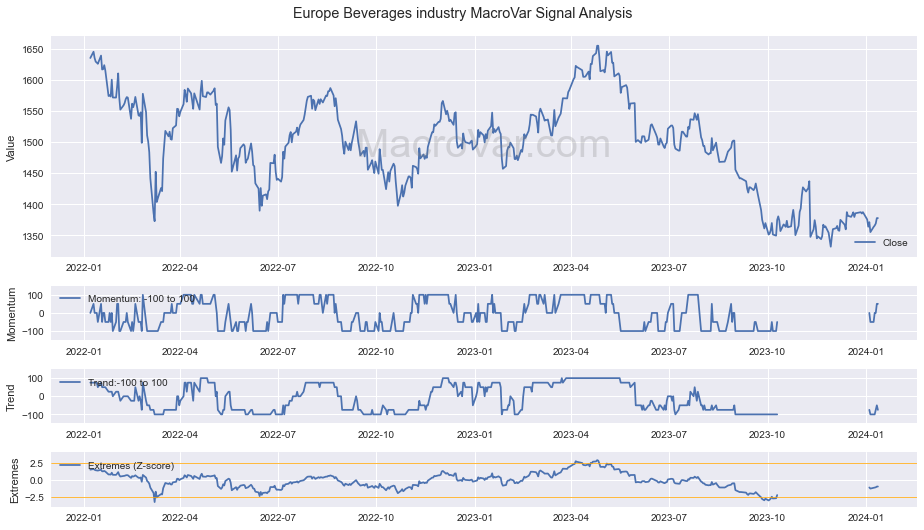
Europe Beverages industry
Europe Beverages industry closed down by -1.5% to 1526.3 on 23 January 2021 and +-2.32% on a weekly basis. Europe Beverages industry momentum was last calculated at +0.0/100 indicating positive momentum. Europe Beverages industry trend is +25.0/100 indicating a positive trend. Europe Beverages industry momentum exhaustion is 0.8478 indicating Europe Beverages industry is oversold.Europe Beverages industry RSI is 51.627 .
Europe Beverages industry Chart
stmk81449 var1=23016endMacroVar offers Free access to our database of historical data for the largest economies and financial markets including economic indicators, stocks, bonds, commodities, currencies and credit default swaps.
- Click the CSV button below to download the last 5 years of historical data.
- Download for Free unlimited historical data by Creating your free account
Date | Value |
---|---|
18-08-22 | 1.581,99 |
17-08-22 | 1.581,78 |
16-08-22 | 1.574,17 |
15-08-22 | 1.574,89 |
12-08-22 | 1.563,73 |
10-08-22 | 1.568,99 |
09-08-22 | 1.561,44 |
08-08-22 | 1.568,65 |
05-08-22 | 1.551,39 |
04-08-22 | 1.566,15 |
Copy the following Code to your Website
MacroVar API for Python offers free access to last 5 years of historical data. click the Copy Button below and run code in your computer.
To get full historical data:
- create a free account
- Use your username and password in the code below.
Get notified instantly when MacroVar new signals are available for Europe Beverages industry. Create your free account
Europe Beverages industry Statistics
Security | Symbol | Last | Momentum | Trend | Oscillator | RSI | 1D% | 1W% | 1M% | 1Y% |
---|---|---|---|---|---|---|---|---|---|---|
Europe Beverages industry | EU.BEVERAGES | 1597.21 | 1 | 1 | 1.61541 | 71.2415 | 0.00645 | 0.0108 | 0.05156 | 0.20746 |
Europe Beverages industry closed at 1526.3 on 23 January 2021. Europe Beverages industry trend was last calculated at +25.0/100 (range: -100 to +100) indicating a positive trend based on MacroVar models. Europe Beverages industry momentum was last calculated at +0.0/100 (range: -100 to +100) indicating positive momentum. Europe Beverages industry momentum exhaustion is 0.8478 (normal range: -2.5 to +2.5, overbought values: greater than 2.5, oversold values: less than 2.5) indicating Europe Beverages industry is oversold and a possible reversal is imminent. Europe Beverages industry RSI was last calculated at 51.627. Europe Beverages industry moving averages were last recorded as follows: 1-month moving average: 1325.05 in a downtrend , 1-quarter moving average: 1270.22 in an uptrend and 1-year moving average: 1214.03 in a downtrend. Europe Beverages industry annual return was last recorded at None%, daily return was last recorded at -1.5%, and weekly return was last recorded at -2.32%. Europe Beverages industry histrorical 20-day volatility was last recorded at 15.855%, Europe Beverages industry alpha None, Europe Beverages industry beta None and Europe Beverages industry maximum drawdown was recorded at None%. MacroVar models monitor Europe Beverages industry statistics based on historical data since 1970.
Europe Beverages industry News
Europe Markets
Market | Symbol | Last | Mom | Trend | Exh | RSI | 1D% | 1W% | 1M% | 1Y% |
---|---|---|---|---|---|---|---|---|---|---|
STOXX Europe 600 | STOXX | 462.77 | -1 | -0.25 | 0.69391 | 36.7305 | -0.00574 | -0.00276 | -0.04276 | 0.17708 |
Eurozone ETF | EZU | 44.77 | 0.5 | -0.5 | -1.54835 | 56.7972 | 0.03467 | 0.02613 | 0.06216 | -0.03596 |
EUR/USD - Euro US Dollar | EURUSD | 0.9019 | 0 | 0.75 | 1.59231 | 48.7867 | -0.00912 | -0.00507 | 0.00345 | 0.07343 |
Europe Economic Indicators
Indicator | Symbol | Actual | Previous | M/M% | Y/Y% | Trend | Slope | ZS5Y | Update |
---|---|---|---|---|---|---|---|---|---|
balance of trade | eu.balanceoftrade | -33977 | -37349.1 | -9.03 | -347.65 | Down | Down | 6.67 | 2022-08-17 |
business confidence | eu.bizconfidence | 2 | 4.8 | -58.33 | -82.46 | Down | Down | 46.67 | 2022-07-31 |
capacity utilization | eu.caputilization | 82.3 | 77.7 | 0.0592021 | -0.0178998 | 1.0 | -1.0 | 0.283333 | 2021-04-01 |
consumer confidence | eu.consconfidence | -27.3 | -24.3 | 12.35 | 565.85 | Down | Down | 1.67 | 2022-07-31 |
consumer price index cpi | eu.cpi | 119.03 | 117.95 | 0.92 | 9.55 | UP | UP | 100 | 2022-07-22 |
core inflation rate | eu.coreinflationrate | 4.51 | 4.14 | 8.94 | 275.83 | UP | UP | 100 | 2022-06-16 |
exports | eu.exports | 224898 | 221052 | 1.74 | 19.38 | UP | UP | 100 | 2022-08-17 |
Real GDP | eu.realgdp | 3403.91 | 3386.94 | 0.5 | -99.91 | Down | Down | 18.33 | 2022-07-31 |
government budget | eu.govbudget | -4.7 | -6.8 | -30.88 | -21.67 | Down | UP | 0 | 2022-04-29 |
government debt | eu.govdebt | 12078200 | 10838300 | 0.1144 | 0.677612 | 1.0 | 1.0 | 0 | 2020-12-31 |
government debt to gdp | eu.govdebtgdp | 88.1 | 90 | -2.11 | 19.05 | UP | UP | 0 | 2022-04-29 |
imports | eu.imports | 258875 | 258401 | 0.18 | 48.4 | UP | UP | 100 | 2022-08-17 |
industrial production | eu.indproduction | 2.7 | -0.8 | -437.5 | -93.06 | Down | Down | 69.17 | 2022-07-16 |
industrial production mom | eu.indproductionmm | 0.6 | 0.3 | 100 | 50 | UP | UP | 65.83 | 2022-07-16 |
long term unemployment rate | eu.ltunemploymentrate | 2.8 | 2.7 | 0.037037 | -0.2 | 1.0 | -1.0 | 0 | 2021-03-31 |
Producer Price Index | eu.producerprices | 152.3 | 150.3 | 1.33 | 36.1 | UP | UP | 100 | 2022-08-03 |
PPI Index | eu.producerpricesch | 36.4 | 37 | -1.62 | 279.17 | UP | UP | 96.67 | 2022-07-05 |
retail sales MoM | eu.retailsales | -1.3 | 0 | 0 | -130.23 | Down | Down | 14.17 | 2022-08-06 |
retail sales yoy | eu.retailsalesan | -2.8 | 0.8 | -450 | -145.16 | Down | Down | 6.67 | 2022-08-06 |
unemployment rate | eu.unemploymentrate | 7.3 | 7.4 | -0.0135135 | 0.140625 | -1.0 | 1.0 | 0.933333 | 2021-03-31 |
youth unemployment rate | eu.ytunemploymentrate | 13.6 | 13.3 | 2.26 | -24.86 | Down | Down | 3.33 | 2022-08-06 |
Central Bank Assets for Euro Area | eu.cb.assets | 7680140 | 7657630 | 0.00293955 | 0.0760296 | 1.0 | 1.0 | 0.633333 | 2021-06-04 |
Construction sector | eu.esi.constr | 0.8 | -5 | -1.16 | -1.0442 | 1.0 | 1.0 | 0.416667 | 2021-04-01 |
Consumer sector | eu.esi.cons | -9 | -12.1 | -0.256198 | -0.590909 | 1.0 | 1.0 | 0.05 | 2021-04-01 |
Manufacturing sector | eu.esi.man | 9.4 | 1.1 | 7.54545 | -1.29102 | 1.0 | 1.0 | 0.4 | 2021-04-01 |
Retail sector | eu.esi.ret | -1.5 | -11 | -0.863636 | -0.948454 | 1.0 | 1.0 | 0.3 | 2021-04-01 |
Services sector | eu.esi.serv | 2.8 | -9.4 | -1.29787 | -1.07254 | 1.0 | 1.0 | 0.216667 | 2021-04-01 |
ESI - Economic Composite | eu.esi.conf | 109.7 | 99.9 | 0.0980981 | 0.634873 | 1.0 | 1.0 | 1 | 2021-04-01 |
Europe Beverages Industry Analysis
MacroVar monitors the performance, risk, trend and momentum of the
Europe Beverages industry by examining the stock and credit performance of major
Europe Beverages companies across the US, Europe, Eastern Europe and Asia Pacific.
Europe Beverages Stock performance is monitored by analyzing STOXX equity indices of major
Europe Beverages companies while Europe Beverages credit performance is monitored by analyzing Markit iBoxx credit indices reflecting the performance of the
Europe Beverages high yield corporate bond market.
MacroVar also monitors fundamental indicators closely linked to the
Europe Beverages sector published monthly including analysis of sector specific PMI indicators, components of Manufacturing & Services PMI and Economic Sentiment Indicators analysis.
MacroVar also monitors other factors closely related to the
Europe Beverages industry like closely related financial markets or macroeconmic indicators.
MacroVar estimates the following signals::
Europe Beverages momentum, Europe Beverages trend,
Europe Beverages oscillator, Europe Beverages RSI and
Europe Beverages returns.
Europe Beverages description
The Alternative Fuels subsector includes companies engaged in the production of Europe Beverages such as ethanol, methanol, hydrogen and biofuels that are mainly used to power vehicles, and companies that are involved in the production of vehicle fuel cells and/or the development of alternative fuelling infrastructure.
Europe Beverages Momentum
Momentum is used to capture moves in shorter timeframes than trends. Momentum is the relative change occurring in markets. Relative change is different to a trend. A long-term trend can be up but the short-term momentum of a specific market can be 0. If a market moves down and then moves up and then moves back down the net relative change in price is 0. That means momentum is 0. A short-term positive momentum, with a long-term downtrend results in markets with no momentum.MacroVar Europe Beverages momentum signal ranges from -100 to +100. The Europe Beverages momentum signal is derived as the mean value from 4 calculations for the Europe Beverages . The timeframes monitored are the following: 1 Day (1 trading day), 1 Week (5 trading days), 1 Month (20 trading days), 3 Months (60 trading days)
For each timeframe, the following calculations are performed: 1. Europe Beverages return is calculated for the specific timeframe and 2. if the return calculated is higher than 0, signal value output is 1 else signal value is -1. Europe Beverages momentum signal is the aggregate of the the 4 values. A technical momentum rollover is identified when Europe Beverages momentum signal moves from positive to negative value or vice-versa.
Europe Beverages trend
Europe Beverages trend signal ranges from -100 to +100. Europe Beverages trend indicator is the mean value of the 8 calculations described below. The timeframes monitored are the following: 1-month (20 trading days), 3-months (60 trading days), 6-months (125 trading days), 1-year (250 trading days)For each timeframe, the following calculations are performed: 1. Europe Beverages Closing price vs Europe Beverages moving average (MA) calculation: If Europe Beverages is greater than Europe Beverages MA value is +1, else -1, 2. Europe Beverages Moving average slope calculation: if current Europe Beverages moving average is higher than the previous MA, Europe Beverages upward slope +1, else -1
Europe Beverages trend model can be used as a trend strength indicator. Europe Beverages trend strength values ranging between +75 and +100 or -75 and -100 show strong trend strength.
A technical trend rollover is identified when Europe Beverages trend strength indicator moves from positive to negative value or vice-versa.
The most important trend indicator
The Europe Beverages 52-week simple moving average and its slope are the most important indicators defining a market’s trend. Europe Beverages is in an uptrend when Europe Beverages price is higher than the 52-week moving average and the Europe Beverages 52-week moving average has an upward slope. If fundamentals of the market have not changed and the moving average slope is still in uptrend, a price drop signifies a market correction and not a change of trend. Traders should watch oscillators like the Europe Beverages oscillator and Europe Beverages RSI to buy the dip and still follow the trend. The moving average slope turn signifies a change of trend.
Europe Beverages oscillator
The Europe Beverages oscillator estimated by MacroVar is the z-score of the currentEurope Beverages price versus Europe Beverages 1-year simple moving average price. The formula for the Europe Beverages oscillator is:Europe Beverages oscillator = (Current Price – 250 trading days Europe Beverages simple moving average price) / (250 days Europe Beverages price standard deviation)
Europe Beverages oversold conditions
Europe Beverages is oversold when it is subject to a persistent downward pressure due to extreme fund outflows. When the Europe Beverages is oversold it is often due for a rebound. Values of the Europe Beverages oscillator lower than -2.5 signify oversold conditions. It must be noted that the Europe Beverages oscillator must be analyzed ibn conjunction with the rest ofEurope Beverages quantitative factors. Traders should pay less attention to overbought or oversold conditions during strong trends. They should pay close attention during counter trends and all combined with the Europe Beverages RSI.
Europe Beverages overbought conditions
Europe Beverages is overbought when it is subject to a persistent upward pressure due to extreme fund inflows. When the Europe Beverages is overbought it is often due for a correction. Values of the Europe Beverages oscillator higher than +2.5 signify overbought conditions. It must be noted that the MacroVar oscillator must be compared to the rest of the Europe Beverages quantitative factors. Traders should pay less attention to overbought or oversold conditions during strong trends. They should pay close attention during counter trends and all combined with the RSI.
Europe Beverages RSI indicator
The RSI indicator measures the speed and change of price movements. The RSI indicator oscillates between 0 and 100. RSI is a useful indicator during normal trending market conditions when an asset price oscillates around its trend value. During big moves and strong trends however, like short squeezes or price spikes RSI and other oscillators don’t work.During normal trend market conditions and when Europe Beverages is in a downtrend RSI values between 50-60 signify overbought conditions before the downtrend is ready to resume. DuringEurope Beverages uptrend, RSI values of 40 to 50 signify oversold conditions before the uptrend is ready to resume. It is strongly not recommended to enter a position when the RSI is “overbought” and falling or vice versa.
Europe Beverages returns
MacroVar calculates Europe Beverages returns for the following timeframes: Daily, Weekly, Monthly, Yearly. The formula for calculating returns is:Europe Beverages returns = (Europe Beverages Closing Price – Europe Beverages Previous Price)/(Europe Beverages Previous Price)