MacroVar model
MacroVar model is a framework to help you understand how the economy and financial markets operate and how they affect your wealth, financial and business decisions.
Introduction
Your life is affected by macroeconomic and financial conditions. Your income, business, debt and assets like your investment portfolio or real estate, and debt depend on these factors.
Stop wasting time reading irrelevant news and focus on understanding how to analyze macroeconomic and financial data to increase your wealth while reducing the risk of financial loss.
This guide is split into 2 sections: a concise 5-page guide of the MacroVar Top-Down core analysis and an in depth 8-page guide of how financial markets work and macroeconomic analysis in detail.
It was created by MacroVar’s professional investors and is based on the extremely important work of one of the best fund managers and economists in the world Ray Dalio. It will help you understand how the economy and financial markets operate, how they affect you, which data to analyse and how to integrate this analysis in your decision making.
Top Down approach
MacroVar analyzes financial markets and economies using a top down approach on the following order: 1. World, 2. Country, 3. State & Local, 4. Sector, 5. Industries of each sector.
MacroVar monitors financial markets and macroeconomic indicators for each of the segments below.
MacroVar’s aim is to monitor markets and economies in order to predict the performance of every sector under investigation in the next 6-12 months.
–>The most important factors which affect economic conditions and financial markets are:
- Global economic growth expectations
- Global Inflation outlook
- Global Liquidity conditions
- Global Risk environment
- Financial Markets
Global Economy & Financial Markets Overview
Global economic growth is the most important factor affecting individual economies, sectors, industries, and all financial assets (stocks, bonds, currencies, and commodities).
Global Economic snapshot
Your can gain an instant insight of the global economy’s conditions by just analyzing 1 indicator, the MacroVar Global PMI which is a weighted average of Manufacturing PMI of the 35 largest economies.
PMI is a leading economic indicator published for each country monthly derived from surveys of private sector companies. The PMI summarizes whether market conditions are expanding, staying the same, or contracting as viewed by managers of the companies surveyed. PMI provides information about current and future business conditions.
Special attention is given to the top four largest economies (United States, Eurozone, China, Japan) comprising more than 50% of global GDP.
Interpreting Global PMI: Readings above 50 indicator economic expansion, while readings below 50 indicate economic contraction. When Global PMI is above 50 global economic growth is expanding and vice-versa. Explore an in-depth overview of the global economy.
Global Liquidity
Global liquidity is the availability of credit in global financial markets. Global liquidity is controlled by central banks using various instruments to inject or remove money from the system. An expansion of global liquidity leads to debt growth which is favorable for financial assets and economic growth and vice versa.
Global Liquidity Snapshot: Global Liquidity is gauged by monitoring the 1. Level of interest rates, 2. balance sheet and 3. Money Supply M2 of the four major central banks of the world namely Federal Reserve (US), ECB (Eurozone), PBoC (China) and BOJ (China).
Global Stocks
Global Stocks are represented by the ACWI and the S&P 500. The stock market is an accurate indicator for predicting future growth. During expansions, stock markets are in uptrend.
Stocks simple indicator: The simplest indicator to gauge stock markets is the 250-day moving average. Historically, when the closing price of a stock index and the 250-day moving average slope is rising financial markets signal that economic growth expectations are favourable. Explore an in-depth overview of the global markets and stock markets.
Global Risk
Global financial risk conditions are especially important since they affect all financial assets and economic growth. Monitoring financial risk is especially important in adjusting financial and business exposure proactively to minimize financial loss.
Global & Country Risk monitor: Global and country risk monitor are derived from many financial and economic indicators (Indicators: Equities, Credit markets, Liquidity, Bonds, FX, Banks, Country). The easiest way to monitor current financial and economic risk is to monitor MacroVar risk management indicators.
Country View
MacroVar analyses the economic and financial conditions of the largest 35 economies in the world by monitoring 40 economic and financial indicators for each country.
However, a quick way to gauge a country’s financial and economic conditions is presented below. Click here to explore how to analyze a country’s economy and financial markets in detail.
Country Economic, Financial & Risk Snapshot
To get a snapshot of your country’s economic health, the most important macroeconomic and financial indicators are the country’s 1. Manufacturing and Services PMI and 2. The performance of the stock market, bonds and currency.
Healthy economic conditions are characterized by growing Manufacturing and Services PMI, good stock market, bond, and currency performance. Another important indicator is the country’s real estate market conditions.
Explore the simple macrovar models used for estimating the trend and momentum for each financial and economic indicator analyzed.
To analyse a specific country for trading or investing in detail, click here to explore the advanced set of macro and financial indicators need to be analysed.
| US Markets | Close | Trend | Momentum | YoY % |
| S&P 500 | 1245.23 | 75% | 50% | 12% |
| US 10-year Treasury | 0.50% | -50% | 100% | 5% |
| US Dollar Index | 90.12 | 100% | 0% | 3.4% |
| US Real Estate Index | 120.12 | 40% | -50% | -2% |
| US Economy | ||||
| Manufacturng PMI | 52.40 | Up | 10% | |
| Services PMI | 45.60 | Up | 5% | |
| Consumer Confidence Index | 90.23 | Up | -1% |
Sector & Industries
All economic activities are categorized in specific sectors and industries in each sector. Your job, business, and investments depend on the overall country’s economic conditions and on the performance of the specific sector in which you operate.
MacroVar analysis aims to help you predict how the sector and industry you operate in will behave in the next 6 to 12 months.
Sectors & Industries Overview
There are two types of sectors: cyclical and defensive. Companies in the cyclical sectors sell goods and services which are in demand only when the economy is strong (e.g. cars). Companies in defensive sectors sell basic goods and services (e.g. soap) which are essential for humans and are not sensitive to economic growth.
Cyclical sector companies are riskier since they go up and down with the economy, while defensive sector companies are steady earners in good and bad times. Cyclical sectors have much higher profitability than defensive sectors when economic growth conditions are strong.
Below is a list of cyclical and defensive sectors in the economy:
| Cyclical Sectors | Defensive Sectors |
| Energy: Oil & Gas, Alternative Energy | Consumer Staples: Food-Beverage, Personal goods |
| Basic Materials: Chemicals, Basic Resources, Mining | HealthCare: Pharma & Biotech |
| Industrials: Construction-Materials, Industrial Goods | Telecommunications: Fixed & Wireless |
| Consumer Discretionary: Automobiles & Parts, Retail | Utilities: Electricity, Gas, Water |
| Consumer Services: Retail, Media, Travel & Leisure | |
| Financials: Banks, Insurance, Real Estate, Fin. Services | |
| IT: Software & Computer Services, Tech Hardware |
Sectors & Industries Indicators
MacroVar monitors each sector’s performance in the United States, Europe and Asia using the following indicators:
- Stock Sector & Industry performance: MacroVar analyses the trend and momentum and other statistics for each sector and industry. You can monitor the sectors & industries current performance here.
- Credit Sector & Industry performance: MacroVar analyses the corporate bonds of each sector and industry in the US and Europe.
- US ISM and NMI Industry Macroeconomic Analysis: MacroVar analyses the US ISM and NMI components to derive the strength or weakness of a specific sector.
- Europe ESI Macroeconomic Analysis: MacroVar analyses ESI sector and industry data for all European countries to estimate a sector’s expected growth based on indicators like Production, Order Books, Export Order Books, Stock Levels, Production Expectations, Selling Price Expectations and Employment expectations.
- Macroeconomic Indicators: MacroVar analyses economic indicators affecting specific sectors and industries. For example. building permits are consistent leading indicators for construction activity in the next twelve month and University of Michigan Consumer Sentiment Index is a leading indicator for retail activity across the United States. A country’s interest rates, Money Supply and the central bank’s monetary policy and government’s fiscal policy are closely monitored to examine liquidity in the economy and aggregate demand.
- Sector & Industry specific News: MacroVar compiles news by sector and industry and delivers the most important developments via your News feed and Newsletter.
The following is an in depth guide of how financial markets work and macroeconomic analysis in detail.
State & Local Analysis
MacroVar monitors economic activity for each state in the US by analyzing the following data:
- Jobless claims: Jobless claims are published weekly and are a good indicator of current economic conditions in the State.
- Leading Index: This economic indicator is published monthly for each state and predicts economic activity in the next six to twelve months
- Coincident Index: This economic indicator is published monthly for each state and analyses the current economic conditions.
- Zillow Real Estate Index: MacroVar analyses on a monthly basis real estate prices for each State using data taken from Zillow. The real estate market is a good indicator of related sectors like the banking and broader construction sectors.
How Financial markets work
The performance of financial assets depend on the macroeconomic conditions and the actions of policymakers. The logic of financial assets is the following:
Risk On vs Risk OffThere are two market environments: Risk On periods during which funds flow from safe assets to risky assets and Risk Off periods where funds flow from risky assets to low-risk assets.
Risk Assets (Risk-On): Stocks, Cyclical Commodities, Cyclical Sectors / Industries, High Yield Bonds, Cyclical Currencies, Emerging Markets (Capital flows to emerging markets in search for higher yields, higher growth rates and hence profits)
Safe Assets (Risk-Off): US Treasuries, German Bunds, Defensive Sectors / Industries, US Dollar DXY, Swiss Franc, Japanese Yen, Gold
The most important asset correlation is between the US stocks and US Bonds. During risk on periods US stocks rise while US bonds are sold and vice-versa. Since equities are closely linked with credit, MacroVar monitors closely the performance of corporate bonds for each sector in US and EU markets.
During Risk on Periods the markets behave as follows:
- Global Risk
- Equity Risk (VIX, VSTOXX): falling
- Credit Risk (CDX IG, ITRAXX IG, BofA High Yield credit spreads): falling
- Volatility Term Structure: steep contango
- MacroVar Risk Index: falling
- MacroVar Risk On/Off monitor Ratios: falling
- Stocks
- Global Stocks rising (ideally this should occur with global bond market weakness)
- US Stock Breadth rising
- Emerging Market Stocks rising (often outperforming developed markets like US & EU)
- Global Stock Breadth rising
- Stock Sectors
- Cyclical sectors outperform Defensive sectors
- Sector breadth rising
- Bonds (MacroVar monitors 2-year, 5-year and 10-year bonds)
- Safe Bonds
- US Treasuries falling (yields rising)
- German Bunds falling (yields rising)
- Risky Bonds
- US High Yield Bonds rising (yields falling)
- Europe: Club Med Bonds rising (yields falling)
- Emerging Markets Bonds rising (yields falling)
- Bond interest rates breadth rising (funds move out of bonds into stocks hence yield rates rise)
- Safe Bonds
- Yield Curve
- Yield Curve Bear steepening (on the contrary a Yield Curve bull re-steepening signifies Risk Off environment)
- Fed Funds futures above US 2-year bonds implying strong economic growth and FED hawkish stance
- Yield Curve Steepening Breadth rising
- Eurodollar Futures rising
- Currencies
- US Dollar (DXY) falling
- Safe Currencies (JPY, CHF) falling
- Risky Currencies (AUD, NZD, CAD) rising
- Currencies Breadth (vs the US Dollar) rising
- Commodities
- Energy (Crude Oil) rising
- Metals (Copper) rising
- Safe commodities (Gold) falling
- Commodities Breadth rising
- Macroeconomic Conditions
- Global PMI trend and momentum rising
- Global PMI breadth monitored strong
Individual country economic growth expectations are gauged using principally each country’s Manufacturing PMI and other business and consumer confidence indicators.
Financial Markets & 4 Economic Envrionments
Financial assets are affected by economic growth and inflation expectations. The performance of each financial asset for each economic environment is explained below.
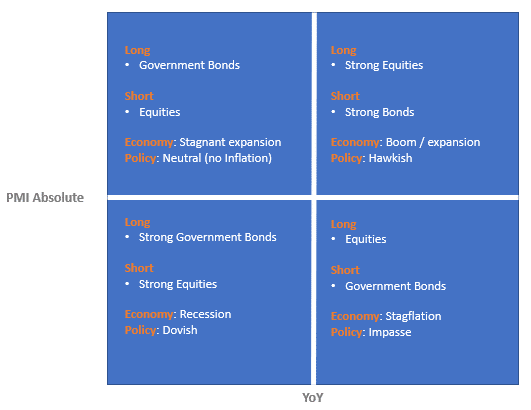
MacroVar uses leading economic indicators for each country to predict economic and inflation expectations. More specifically for each country the Price Expectations and New Orders expectations components of the PMI, ISM and ESI indicators are used for structuring the models.
- Inflation boom: Accelerating Economic growth with Rising inflation
The best performers are emerging market stocks, international real estate, emerging countries’ currencies, commodities, and TIPS (treasury inflation protected securities).
The worst performers are US treasury bonds and cash since they are adversely affected by rising inflation.
High global growth with rising inflation expectations lifts commodities. Many emerging economies growth is linked to commodities. When commodities rise emerging market stocks, currencies and real estate rise as well.
- Stagflation: Slowing Economic Growth with Rising Inflation
The best asset performers protecting investors from inflation are Gold, Cash, Treasury Inflation Protected Securities, and the US Dollar.
The worst performers are long-duration treasury bonds adversely affected by rising inflation.
- Disinflation boom: Accelerating Economic growth with Slowing Inflation
The best performers are developed markets stocks, developed Real estate and US Treasury bonds.
Low inflation with moderate growth is a good environment for bonds and stocks and bad for the worst performs which are commodities and commodity related sectors.
- Deflation Bust: Slowing Economic Growth with Falling Inflation
During this environment the best asset performers are Long-Duration Treasuries and Cash. Everything else experiences big volatility and often large losses.
During crashes and economic depressions bonds rise while stocks and commodities fall. Investors during these environments look for the safety of their asset rushing into the safety of US treasury bonds and the US dollar while selling stocks and commodities.
MacroVar uses leading economic indicators for each country to predict economic and inflation expectations. More specifically, PMI, ISM and ESI components are used for structuring this model. MacroVar also provides a detailed analysis of a country’s economy by analyzing more than 30 indicators for each country. Read more about analyzing a country’s macroeconomics in detail.
Analysis of a specific Financial Market
Every financial market is linked (correlated) with economic growth expectations and other related markets.
Hence, analyzing a financial market requires monitoring the asset’s price dynamics (trend & momentum) and how the financial market reacts against economic indicators affecting it and other related markets.
For example, a specific stock is affected by the company’s fundamentals, it’s sector performance which in turn depends on the country and world economic growth. Moreover, the stock price must be analyzed in combination with the company’s bond price since both markets are closely linked and often a divergence between them may signal an trading opportunity.
MacroVar monitors various macroeconomic and financial factors affecting each financial market. A brief list is provided below. From click on a specific financial market in the World Markets or Sectors sections of MacroVar to examine the related factors.
- Global Manufacturing PMI vs Global Stock Market, US Dollar, Emerging Markets, US 10 year treasury
- Emerging Markets vs US 10 year treasury, US Dollar
- Global Manufacturing PMI vs Cyclical Commodities (Metals, Energy, Shipping)
- Country Stock Market vs Yield Curve, Manufacturing PMI, 10-year Bond, ZEW
- Country Bonds vs Manufacturing PMI, ESI, Inflation, ZEW, Inflation Expectations (ISM, ESI)
- Country Currency vs 10-year Bond, Stock Market, Central Bank B/S, 10-Year bond yield differential, 2-year bond yield differential, Manufacturing PMI, ZEW
- Country ETF vs Manufacturing PMI, ESI, Country Currency, 10-year Bond, CDS, ESI
- US & EU Stock Market vs Credit Index (YoY) – Index and Sector Analysis
- Commodity related currencies vs Metals, Energy
- Gold vs Bonds
- Construction ETF vs Building Permits
- Commodities ETF vs Commodity Futures
- Bank Sector ETF vs Yield Curve
- Equity vs Credit Volatility Indices
Trend & Momentum indicators
Momentum trading is used to capture moves in shorter timeframes than trends. Momentum is the relative change occurring in markets. Relative change is different to a trend. A long-term trend can be up but the short-term momentum of a specific market can be 0.
If a market moves down and then moves up and then moves back down the net relative change in price is 0. That means momentum is 0.
A short-term positive momentum, with a long-term downtrend results in markets with no momentum.
MacroVar Momentum model for Financial Markets
MacroVar Trend signal ranges from -100 to +100. The market trend signal is derived as the mean value from 4 calculations for each asset. The timeframes monitored are the following: 1 Day (1 trading day), 1 Week (5 trading days), 1 Month (20 trading days), 3 Months (60 trading days)
For each timeframe, the following calculations are performed: 1. Calculations of the return for the specific timeframe, 2. If return calculated is higher than 0, signal value 1 else signal value -1
Finally, the 4 values are aggregated daily.
MacroVar Trend model for Financial Markets
The most important trend indicator
The 52-week simple moving average and its slope are the most important indicators defining a market’s trend. An uptrend is characterized by price above the 52-week moving average followed by an upward slope. If fundamentals of the market have not changed and the moving average slope is still in uptrend, a price drop signifies a market correction and not a change of trend. Traders should watch oscillators like MacroVar oscillator and RSI to buy the dip and still follow the trend. The moving average slope turn signifies a change of trend.
MacroVar Trend model for financial markets
MacroVar Trend signal ranges from -100 to +100. The market trend signal is derived as the mean value from 8 calculations for each asset. The timeframes monitored are the following: 1-month (20 trading days), 3-months (60 trading days), 6-months (125 trading days), 1-year (250 trading days)
For each timeframe, the following calculations are performed: 1. Closing price vs moving average (MA): if price greater than MA value is +1, else -1, 2. Moving average slope: if current MA is higher than previous MA, upward slope +1, else -1
MacroVar trend model can be used as a trend strength indicator. MacroVar trend strength values ranging between +75 and +100 or -75 and -100 show strong trend strength.
A technical rollover is identified when MacroVar trend strength indicator moves from positive to negative value or vice-versa.
MacroVar Trend model for Macroeconomic Indicators
A macroeconomic indicator is in an uptrend when last value is higher than its twelve month moving average and its twelve month moving average slope is positive (last twelve month moving average is higher than the previous month’s twelve month moving average)
Lastly, MacroVar calculates the number of months the current value has recorded highs or lows. Trend change is assumed when a specific indicator has recorded a 3-month high / low or more.
MacroVar Momentum model for Macroeconomic Indicators
A macroeconomic indicator’s momentum is monitored by calculating its long-term year over year (Y/Y) return and its short-term month on month (M/M) return.
Country Macroeconomic Overview
Economic Aim: A nation’s economy is healthy when it experiences stable economic growth with low inflation and low unemployment. Economic growth is measured by Real GDP and inflation by CPI, PPI. An economy is affected by its individual performance and its economic performance relative to the rest of the World (RoW).
Policymakers (government & central bank) use fiscal and monetary policy to inject liquidity (print & spend money) during slowdowns (to solve weak economic growth) and withdraw liquidity (buy back money & stop spending money) from an overheating economy (to solve high inflation).
Excessive intervention in the economy may lead to loss of confidence in the country and a financial crisis. The degree of intervention depends on the country’s fundamentals. Read how to analyze a country’s economic in depth.

The four economic environments:
- Inflation boom: Accelerating Economic growth with Rising inflation
- Stagflation: Slowing Economic Growth with Rising Inflation
- Disinflation boom: Accelerating Economic growth with Slowing Inflation
- Deflation Bust: Slowing Economic Growth with Falling Inflation
MacroVar uses leading economic indicators for each country to predict economic and inflation expectations. More specifically for each country the Price Expectations and New Orders expectations components of the PMI, ISM and ESI indicators are used for structuring the models.
Country Macroeconomic Analysis
This analysis is based on the work of Ray Dalio and more specifically how the economic machine works
Introduction: An economy is the sum of the transactions that make it up. A country’s economy is comprised of the public and private sector. The private sector is comprised of businesses and consumers.
Economic activity is driven by 1. Productivity growth (GDP growth 2% per year due knowledge increase), 2. the Long-term debt cycle (50-75 years), 3. the business cycle (5-8 years). Credit (promise to pay) is driven by the debt cycle. If credit is used to purchase productive resources, it helps economic growth and income. If credit is used for consumption it has no added value (version 2 expand on this)
Money and Credit: Economic transactions are filled with either money or credit (promise to pay). The availability of credit is determined by the country’s central bank. Credit used to purchase productive resources generating sufficient income to service the debt, helps economic growth and income.
Country versus Rest of the World: A country’s finances consist of a simple income statement (revenue–expenses) and a balance sheet (assets–liabilities). Exports are imports are the main revenue and expense for countries. Uncompetitive economies have negative net income (imports higher than exports), which is financed by either savings (FX & Gold reserves) or rising debt (owed to exporters).
Debt: A nation’s debt is categorized as local currency debt and FX debt. Local debt is manageable since a country’s central bank can print money and repay it. FX debt is controlled by foreign central banks hence it is difficult to be repaid. For example. Turkey has US dollar denominated debt. Only the US central bank (the Federal Reserve), can print US dollars hence FX debt is out of Turkey’s control.
A country can control its debt by either: 1. Inflate it away, 2. Restructure, 3. Default. The US aims to keep nominal GDP growth above interest rates (kept low) to gradually reduce its debt.
Injections & Withdrawals
The government and central bank use fiscal and monetary policies to inject liquidity during slowdowns to boost growth and withdraw liquidity from an overheating economy to control rising inflation. The available policies and tools used during recessions are the following:
Monetary Policies (MP)
1. Reduce short-term interest rates > Boost Economic growth by 1. Raising Credit, Easing Debt service
2. Print money > purchase financial assets > force investors to take more risk & create wealth effect
3. Print Money > purchase new debt issued to finance Gov. deficits when no local or foreign investors
Fiscal Policies (FP)
Expansionary FP is when government spends more than tax received to boost economic growth. This is financed by issuing new debt financed by 1. domestic or foreign investors or 2. CB money printing
Currency vs Injections & Withdrawals and inflation
The degree of economic intervention depends on the country’s economic fundamentals, its currency status and credibility. Countries with reserve currencies or strong fundamentals are allowed by markets to intervene. However, when nations with weak economic fundamentals intervene heavily, confidence is lost, causing a capital flight out of the country, spiking inflation and interest rates which lead to a severe recession, political and social crisis.
Reserve vs Non-reserve currencies: Reserve currencies are used by countries and corporations to borrow funds, store wealth and for international transactions (buy commodities). They are considered low risk. The US dollar is the world’s largest reserve currency. The main advantage of reserve currency nations is their ability to borrow (issue debt) on their own currency. These countries have increased power to conduct monetary and fiscal policies to boost their economies. However, prolonged expansionary fiscal and monetary policies eventually lead to loss of confidence in these currencies as a store of value and potential inflationary crisis.
Non-reserve currency countries: Conversely, developing nations are not considered low risk hence their ability to borrow in their own currencies is limited. Their economic growth is dependent on foreign capital inflows denominated in foreign currencies like the US dollar. During periods of global economic growth, capital flows from developed markets into developing nations looking for higher returns. These economies and their corporations’ issue foreign debt to grow. However, during periods of weak global economic growth or financial stress, foreign capital flows (also called capital flight) back to developed countries causing an inability of countries and companies to repay their debt. Central banks gather foreign exchange reserves during growth periods to create a cushion against capital outflows.
A nation’s economy is vulnerable to economic weakness or financial stress when it experiences:
- Current account deficit: a current account deficit indicates an uncompetitive economy which relies on foreign capital to sustain its spending. Hence, is vulnerable to capital outflows
- Government deficit: a big government deficit indicates an economy relying or rising debt to finance its operations
- Debt/GDP: a high Debt/GDP pushes a nation to borrow large amounts to finance its debt, print money or default. Historically, Debt/GDP higher than 100% is a red warning for economies.
- Low or no foreign exchange reserves: Developing economies are vulnerable to capital flight since foreign exchange reserves provide a cushion against capital outflows
- High external debt: Nations are vulnerable to high external debts which may be caused by a sudden depreciation of their currency or rising foreign interest rates (due to foreign growth)
- Negative real interest rates: Lower interest rates than inflation, are not compensating lenders for holding a nation’s debt hence making nation’s currency vulnerable to capital outflows.
- A history of high inflation and negative total returns: Nations with bad history have lack of trust in value of their currency and debt
Currency Fundamentals
A country’s currency strength is determined in the long run by its current account balance, and in the short-term by the relative dynamics of interest rates, supply/demand imbalances and policymakers.
US Dollar
The US Dollar is affected by the US economy and global market conditions. During global economic expansions, funds flow out of the US into emerging markets searching for higher investment returns causing the US Dollar to depreciate.
Conversely, during global economic slowdowns, global market risk is high, credit conditions are tight and funds flow into the US in search for low-risk safe assets causing the US Dollar to appreciate. Economic divergences between the US economy and the rest of the world may also cause US dollar to appreciate. When the US economy outperforms other economies, the Fed may raise short-term rates higher related to other countries causing funds to flow back to the US.
Which economies succeed and Fail
A country’s success is determined by three factors:
- Productivity: producing more by working harder or smarter
- Culture: Sacrificing life for achievement, innovation, commercialism, low bureaucracy, corruption, rule of law
- Indebtedness: low debt to income
(reference: how the economic machine works)
How MacroVar Works
Step 1: Sign Up
To sign up use your Google or Facebook automatic sign in options. Alternatively, enter your email in the form on the right.
Step 2: Select your User type
Once you sign up, you will be prompted to select your user type.
Step 3: Newsfeed
MacroVar main page is Newsfeed where you will automatically be notified on economic and financial developments based on your profile.
Step 4: Personalise your Profile
To get personalised financial advice from MacroVar you must complete your profile. MacroVar will provide you with analysis, education, and tools to analyse how economic and financial developments affect your financial profile and how to grow and protect your wealth.
Step 5: Personalised Newsletter
Every morning MacroVar will send you a newsletter customized to your profile, with analysis and reports of market and economic developments realted to your financial profile.