Finland Economy
Finland’s gdp growth annual decreased to -2.7 by -56.45% on July 2020 from -6.2 in the previous Quarterly. On a year on year basis Finland’s gdp growth annual decreased by -208.0%. Finland’s gdp growth annual trend is down since the current value of -2.7 is lower than the 12 month moving average of 0.258333.Finland’s inflation cpi decreased to 0.2 by -66.67% on August 2020 from 0.6 in the previous Monthly. On a year on year basis Finland’s inflation cpi decreased by -75.0%. Finland’s inflation cpi trend is down since the current value of 0.2 is lower than the 12 month moving average of 0.583333.Finland’s unemployment rate decreased to 6.9 by -6.76% on November 2020 from 7.4 in the previous Monthly. On a year on year basis Finland’s unemployment rate increased by 16.95%. Finland’s unemployment rate trend is down since the current value of 6.9 is lower than the 12 month moving average of 7.60833.
Finland Macroeconomic model
MacroVar Finland Macro model analyzes economic growth and inflation to assess the current economic conditions. Economic growth and inflation expectations are the two most important economic indicators used to assess economic conditions, forecast financial market returns and policymaker response. Finland’s current macroeconomic conditions are summarized below the chart. Click here to learn more about MacroVar Finland macroecononic model and the leading economic indicators used for analysis.Finland News
Finland Economy
Economic Activity Overview | Actual | Previous | M/M% | Y/Y% | Trend | Slope | ZS5Y | Update |
---|---|---|---|---|---|---|---|---|
gdp growth annual | 4.3 | 2.9 | 48.28 | 975 | UP | UP | 90 | 2022-05-15 |
inflation cpi | 7 | 5.7 | 22.81 | 233.33 | UP | UP | 100 | 2022-06-14 |
unemployment rate | 7.9 | 6.9 | 14.49 | -2.47 | UP | Down | 66.67 | 2022-06-22 |
Business & Consumer Forecast Overview | Actual | Previous | M/M% | Y/Y% | Trend | Slope | ZS5Y | Update |
---|---|---|---|---|---|---|---|---|
ESI - Economic Composite | 109.8 | 96.6 | 0.136646 | 0.542135 | 1.0 | 1.0 | 1 | 2021-04-01 |
Reserves & Outstanding Debt | Actual | Previous | M/M% | Y/Y% | Trend | Slope | ZS5Y | Update |
---|---|---|---|---|---|---|---|---|
government debt | 126111 | 125373 | 0.00588644 | 0.0702701 | 1.0 | 1.0 | 0.8 | 2021-05-31 |
government debt to gdp | 65.8 | 69 | -4.64 | 57.79 | UP | UP | 0 | 2022-04-29 |
external debt | 588467 | 515670 | 14.12 | 8.98 | UP | UP | 98.33 | 2022-06-24 |
foreign exchange reserves | 15151 | 15427 | -1.79 | 35.64 | UP | UP | 98.33 | 2022-06-22 |
gold reserves | 49.14 | 49.14 | 0 | 0 | 1.0 | -1.0 | 0.516667 | 2020-08-01 |
Trade | Actual | Previous | M/M% | Y/Y% | Trend | Slope | ZS5Y | Update |
---|---|---|---|---|---|---|---|---|
current account | -2286 | -1222 | 87.07 | 249.54 | Down | Down | 3.33 | 2022-06-14 |
current account to gdp | 0.3 | -0.3 | -2 | -0.857143 | 1.0 | -1.0 | 0 | 2020-01-31 |
Monetary Policy | Actual | Previous | M/M% | Y/Y% | Trend | Slope | ZS5Y | Update |
---|---|---|---|---|---|---|---|---|
interest rate | 0.05 | 0.05 | 0 | 0 | 1.0 | -1.0 | 0.791667 | 2016-03-09 |
central bank balance sheet | 631.79 | 644.1 | -1.91 | 19.52 | UP | UP | 73.33 | 2022-06-06 |
banks balance sheet | 293401 | 283268 | 3.58 | 20.11 | UP | UP | 100 | 2022-06-11 |
money supply m2 | 194586 | 195509 | -0.47 | 4.72 | UP | UP | 96.67 | 2022-06-06 |
Fiscal Policy | Actual | Previous | M/M% | Y/Y% | Trend | Slope | ZS5Y | Update |
---|---|---|---|---|---|---|---|---|
Government budget | 370.5 | -281.1 | -2.31804 | -2.29139 | 1.0 | 1.0 | 0.116667 | 2021-05-31 |
government revenues | 5399.8 | 4285.2 | 0.260105 | 0.139415 | 1.0 | 1.0 | 0.866667 | 2021-05-31 |
fiscal expenditure | 4566 | 5353 | -0.14702 | -0.0612278 | -1.0 | -1.0 | 0.0833333 | 2021-04-30 |
Finland’s gdp growth annual decreased to -2.7 by -56.45% on July 2020 from -6.2 in the previous Quarterly. On a year on year basis Finland’s gdp growth annual decreased by -208.0%. Finland’s gdp growth annual trend is down since the current value of -2.7 is lower than the 12 month moving average of 0.258333.Finland’s inflation cpi decreased to 0.2 by -66.67% on August 2020 from 0.6 in the previous Monthly. On a year on year basis Finland’s inflation cpi decreased by -75.0%. Finland’s inflation cpi trend is down since the current value of 0.2 is lower than the 12 month moving average of 0.583333.Finland’s unemployment rate decreased to 6.9 by -6.76% on November 2020 from 7.4 in the previous Monthly. On a year on year basis Finland’s unemployment rate increased by 16.95%. Finland’s unemployment rate trend is down since the current value of 6.9 is lower than the 12 month moving average of 7.60833.Finland’s building permits icnreased to 3052.0 by 208.28% on August 2020 from 990.0 in the previous Monthly. On a year on year basis Finland’s building permits increased by 15.17%. Finland’s building permits trend is down since the current value of 3052.0 is lower than the 12 month moving average of 2946.83.Finland’s business confidence decreased to -15.0 by -10.18% on November 2020 from -16.7 in the previous Monthly. On a year on year basis Finland’s business confidence increased by 117.39%. Finland’s business confidence trend is down since the current value of -15.0 is lower than the 12 month moving average of -16.1333.Finland’s consumer confidence decreased to -4.6 by -4.17% on December 2020 from -4.8 in the previous Monthly. On a year on year basis Finland’s consumer confidence increased by 9.52%. Finland’s consumer confidence trend is down since the current value of -4.6 is lower than the 12 month moving average of -5.99167.
Finland Business activity
Business Activity | Actual | Previous | M/M% | Y/Y% | Trend | Slope | ZS5Y | Update |
---|---|---|---|---|---|---|---|---|
business confidence | 13.9 | 15.3 | -9.15 | -7.33 | Down | Down | 68.33 | 2022-05-26 |
ESI - Economic Composite | 109.8 | 96.6 | 0.136646 | 0.542135 | 1.0 | 1.0 | 1 | 2021-04-01 |
Manufacturing sector | 9.8 | 0.4 | 23.5 | -1.42795 | 1.0 | 1.0 | 0.25 | 2021-04-01 |
Consumer sector | 4.4 | -2.6 | -2.69231 | -1.33588 | 1.0 | 1.0 | 0.266667 | 2021-04-01 |
Construction sector | -8.6 | -17.9 | -0.519553 | -0.627706 | 1.0 | 1.0 | 0.616667 | 2021-04-01 |
Retail sector | 11.6 | 1 | 10.6 | -1.44788 | 1.0 | 1.0 | 0.316667 | 2021-04-01 |
Services sector | 7.8 | -10.1 | -1.77228 | -1.19898 | 1.0 | 1.0 | 0.216667 | 2021-04-01 |
Finland’s business confidence decreased to -15.0 by -10.18% on November 2020 from -16.7 in the previous Monthly. On a year on year basis Finland’s business confidence increased by 117.39%. Finland’s business confidence trend is down since the current value of -15.0 is lower than the 12 month moving average of -16.1333.Finland’s ESI – Economic Composite icnreased to 86.6 by 164.0% on January 2021 from 85.2 in the previous . On a year on year basis Finland’s ESI – Economic Composite decreased by -1017.0%. Finland’s ESI – Economic Composite trend is down since the current value of 86.6 is lower than the 12 month moving average of 84.675.Finland’s ESI – Economic Composite icnreased to 86.6 by 164.0% on January 2021 from 85.2 in the previous . On a year on year basis Finland’s ESI – Economic Composite decreased by -1017.0%. Finland’s ESI – Economic Composite trend is down since the current value of 86.6 is lower than the 12 month moving average of 84.675.Finland’s Manufacturing sector decreased to -15.0 by -1018.0% on January 2021 from -16.7 in the previous . On a year on year basis Finland’s Manufacturing sector increased by 11739.0%. Finland’s Manufacturing sector trend is down since the current value of -15.0 is lower than the 12 month moving average of -16.1333.Finland’s Consumer sector decreased to -4.2 by -3438.0% on January 2021 from -6.4 in the previous . On a year on year basis Finland’s Consumer sector decreased by -233.0%. Finland’s Consumer sector trend is down since the current value of -4.2 is lower than the 12 month moving average of -6.25.Finland’s Construction sector icnreased to -21.0 by 2353.0% on January 2021 from -17.0 in the previous . On a year on year basis Finland’s Construction sector decreased by -40000.0%. Finland’s Construction sector trend is down since the current value of -21.0 is lower than the 12 month moving average of -12.25.Finland’s Retail sector decreased to -2.8 by -6000.0% on January 2021 from -7.0 in the previous . On a year on year basis Finland’s Retail sector decreased by -12917.0%. Finland’s Retail sector trend is down since the current value of -2.8 is lower than the 12 month moving average of -6.55.Finland’s Services sector On a year on year basis Finland’s Services sector decreased by -27857.0%. Finland’s Services sector trend is down since the current value of -15.0 is lower than the 12 month moving average of -14.6917.
Finland Consumer activity
Consumer Activity | Actual | Previous | M/M% | Y/Y% | Trend | Slope | ZS5Y | Update |
---|---|---|---|---|---|---|---|---|
consumer confidence | -14.3 | -11.6 | 23.28 | -629.63 | Down | Down | 1.67 | 2022-06-24 |
car registrations | 7941 | 6431 | 23.48 | -20.3 | UP | Down | 30 | 2022-06-14 |
Consumer - General economic situation (next 12 months) | 1.1 | -9.8 | -1.11224 | -1.03481 | 1.0 | 1.0 | 0.4 | 2021-04-01 |
Consumer - Financial situation (next 12 months) | 13.3 | 11 | 0.209091 | 3.58621 | 1.0 | 1.0 | 1 | 2021-04-01 |
Consumer - Price trends (next 12 months) | 29.7 | 32.4 | -0.0833333 | 0.116541 | 1.0 | 1.0 | 0.466667 | 2021-04-01 |
Consumer - Unemployment expectations (next 12 months) | 11.7 | 28.5 | -0.589474 | -0.787659 | -1.0 | -1.0 | 0.466667 | 2021-04-01 |
Consumer - Major purchases (next 12 months) | -5.6 | -13.9 | -0.597122 | -0.774194 | 1.0 | 1.0 | 0.0166667 | 2021-04-01 |
Consumer - Savings (next 12 months) | 53.1 | 48.5 | 0.0948454 | 0.198646 | 1.0 | 1.0 | 1 | 2021-04-01 |
Consumer - Households Financial situation | 32.9 | 31.2 | 0.0544872 | 0.104027 | 1.0 | 1.0 | 0.683333 | 2021-04-01 |
retail sales yoy | 4.8 | 4.7 | 0.0212766 | 0.2 | 1.0 | 1.0 | 0.583333 | 2021-02-28 |
Finland’s consumer confidence decreased to -4.6 by -4.17% on December 2020 from -4.8 in the previous Monthly. On a year on year basis Finland’s consumer confidence increased by 9.52%. Finland’s consumer confidence trend is down since the current value of -4.6 is lower than the 12 month moving average of -5.99167.Finland’s car registrations decreased to 7374.0 by -1.67% on November 2020 from 7499.0 in the previous Monthly. On a year on year basis Finland’s car registrations decreased by -15.05%. Finland’s car registrations trend is down since the current value of 7374.0 is lower than the 12 month moving average of 8039.42.Finland’s Consumer – General economic situation (next 12 months) decreased to -13.4 by -3679.0% on January 2021 from -21.2 in the previous . On a year on year basis Finland’s Consumer – General economic situation (next 12 months) decreased by -2984.0%. Finland’s Consumer – General economic situation (next 12 months) trend is down since the current value of -13.4 is lower than the 12 month moving average of -19.45.Finland’s Consumer – Financial situation (next 12 months) icnreased to 7.8 by 685.0% on January 2021 from 7.3 in the previous . On a year on year basis Finland’s Consumer – Financial situation (next 12 months) decreased by -1236.0%. Finland’s Consumer – Financial situation (next 12 months) trend is down since the current value of 7.8 is lower than the 12 month moving average of 7.525.Finland’s Consumer – Price trends (next 12 months) decreased to 19.4 by -51.0% on January 2021 from 19.5 in the previous . On a year on year basis Finland’s Consumer – Price trends (next 12 months) decreased by -2422.0%. Finland’s Consumer – Price trends (next 12 months) trend is down since the current value of 19.4 is lower than the 12 month moving average of 25.5333.Finland’s Consumer – Unemployment expectations (next 12 months) decreased to 31.8 by -3011.0% on January 2021 from 45.5 in the previous . On a year on year basis Finland’s Consumer – Unemployment expectations (next 12 months) increased by 14651.0%. Finland’s Consumer – Unemployment expectations (next 12 months) trend is down since the current value of 31.8 is lower than the 12 month moving average of 27.2917.Finland’s Consumer – Major purchases (next 12 months) icnreased to -14.3 by 214.0% on January 2021 from -14.0 in the previous . On a year on year basis Finland’s Consumer – Major purchases (next 12 months) increased by 438.0%. Finland’s Consumer – Major purchases (next 12 months) trend is down since the current value of -14.3 is lower than the 12 month moving average of -15.9667.Finland’s Consumer – Savings (next 12 months) decreased to 46.9 by -676.0% on January 2021 from 50.3 in the previous . On a year on year basis Finland’s Consumer – Savings (next 12 months) decreased by -768.0%. Finland’s Consumer – Savings (next 12 months) trend is down since the current value of 46.9 is lower than the 12 month moving average of 46.775.Finland’s Consumer – Households Financial situation decreased to 30.3 by -66.0% on January 2021 from 30.5 in the previous . On a year on year basis Finland’s Consumer – Households Financial situation increased by 783.0%. Finland’s Consumer – Households Financial situation trend is down since the current value of 30.3 is lower than the 12 month moving average of 29.0583.Finland’s retail sales yoy icnreased to 5.3 by 12.77% on August 2020 from 4.7 in the previous Monthly. On a year on year basis Finland’s retail sales yoy increased by 35.9%. Finland’s retail sales yoy trend is down since the current value of 5.3 is lower than the 12 month moving average of 3.3.
Finland Manufacturing activity
Manufacturing Activity | Actual | Previous | M/M% | Y/Y% | Trend | Slope | ZS5Y | Update |
---|---|---|---|---|---|---|---|---|
Manufacturing sector | 9.8 | 0.4 | 23.5 | -1.42795 | 1.0 | 1.0 | 0.25 | 2021-04-01 |
Manufacturing - Order Books | -0.6 | -14.1 | -0.957447 | -0.955882 | 1.0 | 1.0 | 0.416667 | 2021-04-01 |
Manufacturing - Selling Price expectations (next months) | 28.9 | 16.1 | 0.795031 | -2.74096 | 1.0 | 1.0 | 0.166667 | 2021-04-01 |
Manufacturing - Production trend (recent months) | 21.3 | -3.2 | -7.65625 | -2.18333 | 1.0 | 1.0 | 0.2 | 2021-04-01 |
Manufacturing - Export Order Books | -4.3 | -16.9 | -0.745562 | -0.779487 | 1.0 | 1.0 | 0.5 | 2021-04-01 |
Manufacturing - Finished Products (Stock Levels) | -3.4 | -2 | 0.7 | -1.22973 | -1.0 | -1.0 | 0.25 | 2021-04-01 |
Manufacturing - Production expectations (next months) | 26.6 | 13.2 | 1.01515 | -1.65842 | 1.0 | 1.0 | 0.266667 | 2021-04-01 |
industrial production | 7.3 | 2.2 | 231.82 | 265 | UP | UP | 93.33 | 2022-06-14 |
industrial production mom | 3.4 | -1.4 | -342.86 | 142.86 | UP | UP | 96.67 | 2022-06-14 |
capacity utilization | 80.2 | 82.2 | -2.43 | -0.74 | UP | Down | 58.33 | 2022-05-04 |
Finland’s Manufacturing sector decreased to -15.0 by -1018.0% on January 2021 from -16.7 in the previous . On a year on year basis Finland’s Manufacturing sector increased by 11739.0%. Finland’s Manufacturing sector trend is down since the current value of -15.0 is lower than the 12 month moving average of -16.1333.Finland’s Manufacturing – Order Books icnreased to -32.7 by 548.0% on January 2021 from -31.0 in the previous . On a year on year basis Finland’s Manufacturing – Order Books increased by 26333.0%. Finland’s Manufacturing – Order Books trend is down since the current value of -32.7 is lower than the 12 month moving average of -23.9667.Finland’s Manufacturing – Selling Price expectations (next months) decreased to -2.6 by -14643.0% on January 2021 from 5.6 in the previous . On a year on year basis Finland’s Manufacturing – Selling Price expectations (next months) decreased by -7476.0%. Finland’s Manufacturing – Selling Price expectations (next months) trend is down since the current value of -2.6 is lower than the 12 month moving average of -4.85833.Finland’s Manufacturing – Production trend (recent months) decreased to -6.0 by -6552.0% on January 2021 from -17.4 in the previous . On a year on year basis Finland’s Manufacturing – Production trend (recent months) increased by 5385.0%. Finland’s Manufacturing – Production trend (recent months) trend is down since the current value of -6.0 is lower than the 12 month moving average of -19.9333.Finland’s Manufacturing – Export Order Books decreased to -31.3 by -1158.0% on January 2021 from -35.4 in the previous . On a year on year basis Finland’s Manufacturing – Export Order Books increased by 12681.0%. Finland’s Manufacturing – Export Order Books trend is down since the current value of -31.3 is lower than the 12 month moving average of -28.475.Finland’s Manufacturing – Finished Products (Stock Levels) icnreased to 5.2 by 1064.0% on January 2021 from 4.7 in the previous . On a year on year basis Finland’s Manufacturing – Finished Products (Stock Levels) decreased by -6667.0%. Finland’s Manufacturing – Finished Products (Stock Levels) trend is down since the current value of 5.2 is lower than the 12 month moving average of 10.0.Finland’s Manufacturing – Production expectations (next months) decreased to -7.1 by -5137.0% on January 2021 from -14.6 in the previous . On a year on year basis Finland’s Manufacturing – Production expectations (next months) decreased by -28684.0%. Finland’s Manufacturing – Production expectations (next months) trend is down since the current value of -7.1 is lower than the 12 month moving average of -14.4917.Finland’s industrial production decreased to -2.2 by -62.07% on October 2020 from -5.8 in the previous Monthly. On a year on year basis Finland’s industrial production decreased by -229.41%. Finland’s industrial production trend is down since the current value of -2.2 is lower than the 12 month moving average of -2.66667.Finland’s industrial production mom decreased to -2.1 by -216.67% on September 2020 from 1.8 in the previous Monthly. On a year on year basis Finland’s industrial production mom decreased by -625.0%. Finland’s industrial production mom trend is down since the current value of -2.1 is lower than the 12 month moving average of -0.466667.Finland’s capacity utilization decreased to 75.4 by -0.79% on August 2020 from 76.0 in the previous Quarterly. On a year on year basis Finland’s capacity utilization decreased by -9.81%. Finland’s capacity utilization trend is down since the current value of 75.4 is lower than the 12 month moving average of 80.6167.
Finland Services activity
Services Activity | Actual | Previous | M/M% | Y/Y% | Trend | Slope | ZS5Y | Update |
---|---|---|---|---|---|---|---|---|
Services sector | 7.8 | -10.1 | -1.77228 | -1.19898 | 1.0 | 1.0 | 0.216667 | 2021-04-01 |
Services - Demand Expectations (next 3 months) | 19.6 | -5.8 | -4.37931 | -1.40412 | 1.0 | 1.0 | 0.116667 | 2021-04-01 |
Services - Prices expectations (next 3 months) | 8.7 | -3.3 | -3.63636 | -1.87 | 1.0 | 1.0 | 0.15 | 2021-04-01 |
Services - Business activity (past 3 months) | -2.9 | -16.3 | -0.822086 | -0.946296 | 1.0 | 1.0 | 0.433333 | 2021-04-01 |
Services - Demand (past 3 months) | 6.7 | -8.1 | -1.82716 | -1.44079 | 1.0 | 1.0 | 0.2 | 2021-04-01 |
Services - Employment (past 3 months) | -9.9 | -17.3 | -0.427746 | -0.220472 | 1.0 | 1.0 | 0.5 | 2021-04-01 |
Services - Employment (next 3 months) | 7 | -10.2 | -1.68627 | -1.22364 | 1.0 | 1.0 | 0.283333 | 2021-04-01 |
Finland’s Services sector On a year on year basis Finland’s Services sector decreased by -27857.0%. Finland’s Services sector trend is down since the current value of -15.0 is lower than the 12 month moving average of -14.6917.Finland’s Services – Demand Expectations (next 3 months) decreased to -4.6 by -3521.0% on January 2021 from -7.1 in the previous . On a year on year basis Finland’s Services – Demand Expectations (next 3 months) decreased by -12659.0%. Finland’s Services – Demand Expectations (next 3 months) trend is down since the current value of -4.6 is lower than the 12 month moving average of -6.80833.Finland’s Services – Prices expectations (next 3 months) decreased to -0.5 by -9597.0% on January 2021 from -12.4 in the previous . On a year on year basis Finland’s Services – Prices expectations (next 3 months) decreased by -10633.0%. Finland’s Services – Prices expectations (next 3 months) trend is down since the current value of -0.5 is lower than the 12 month moving average of 0.616667.Finland’s Services – Business activity (past 3 months) On a year on year basis Finland’s Services – Business activity (past 3 months) increased by 53684.0%. Finland’s Services – Business activity (past 3 months) trend is down since the current value of -24.2 is lower than the 12 month moving average of -29.1083.Finland’s Services – Demand (past 3 months) icnreased to -16.2 by 2000.0% on January 2021 from -13.5 in the previous . On a year on year basis Finland’s Services – Demand (past 3 months) decreased by -18060.0%. Finland’s Services – Demand (past 3 months) trend is down since the current value of -16.2 is lower than the 12 month moving average of -9.125.Finland’s Services – Employment (past 3 months) decreased to -23.9 by -440.0% on January 2021 from -25.0 in the previous . On a year on year basis Finland’s Services – Employment (past 3 months) decreased by -142778.0%. Finland’s Services – Employment (past 3 months) trend is down since the current value of -23.9 is lower than the 12 month moving average of -10.4583.Finland’s Services – Employment (next 3 months) decreased to -13.8 by -4630.0% on January 2021 from -25.7 in the previous . On a year on year basis Finland’s Services – Employment (next 3 months) decreased by -25682.0%. Finland’s Services – Employment (next 3 months) trend is down since the current value of -13.8 is lower than the 12 month moving average of -7.225.
Finland Retail Sector
Retail Activity | Actual | Previous | M/M% | Y/Y% | Trend | Slope | ZS5Y | Update |
---|---|---|---|---|---|---|---|---|
Retail sector | 11.6 | 1 | 10.6 | -1.44788 | 1.0 | 1.0 | 0.316667 | 2021-04-01 |
Retail - Orders Expectations (next 3 months) | 8.6 | -10 | -1.86 | -1.17587 | 1.0 | 1.0 | 0.333333 | 2021-04-01 |
Retail - Prices expectations (next 3 months) | 21 | 1.8 | 10.6667 | -1.98131 | 1.0 | 1.0 | 0.183333 | 2021-04-01 |
Retail - Business activity (past 3 months) | 16.8 | 14.1 | 0.191489 | -2.75 | 1.0 | 1.0 | 0.15 | 2021-04-01 |
Retail - Stock Levels | -2.2 | 0.7 | -4.14286 | -1.17742 | -1.0 | -1.0 | 0.216667 | 2021-04-01 |
Retail - Business activity expectations (next 3 months) | 15.7 | -10.5 | -2.49524 | -1.28187 | 1.0 | 1.0 | 0.3 | 2021-04-01 |
Retail - Employment expectations (next 3 months) | 1.7 | -13.4 | -1.12687 | -1.03908 | 1.0 | 1.0 | 0.333333 | 2021-04-01 |
retail sales MoM | 1.3 | 2.7 | -0.518519 | -0.133333 | 1.0 | -1.0 | 0.7 | 2021-02-28 |
Finland’s Retail sector decreased to -2.8 by -6000.0% on January 2021 from -7.0 in the previous . On a year on year basis Finland’s Retail sector decreased by -12917.0%. Finland’s Retail sector trend is down since the current value of -2.8 is lower than the 12 month moving average of -6.55.Finland’s Retail – Orders Expectations (next 3 months) decreased to -16.6 by -3712.0% on January 2021 from -26.4 in the previous . On a year on year basis Finland’s Retail – Orders Expectations (next 3 months) decreased by -25514.0%. Finland’s Retail – Orders Expectations (next 3 months) trend is down since the current value of -16.6 is lower than the 12 month moving average of -16.0333.Finland’s Retail – Prices expectations (next 3 months) decreased to 2.3 by -13966.0% on January 2021 from -5.8 in the previous . On a year on year basis Finland’s Retail – Prices expectations (next 3 months) decreased by -4773.0%. Finland’s Retail – Prices expectations (next 3 months) trend is down since the current value of 2.3 is lower than the 12 month moving average of -3.44167.Finland’s Retail – Business activity (past 3 months) decreased to 3.7 by -4394.0% on January 2021 from 6.6 in the previous . On a year on year basis Finland’s Retail – Business activity (past 3 months) decreased by -8333.0%. Finland’s Retail – Business activity (past 3 months) trend is down since the current value of 3.7 is lower than the 12 month moving average of -1.95833.Finland’s Retail – Stock Levels decreased to 0.8 by -8222.0% on January 2021 from 4.5 in the previous . On a year on year basis Finland’s Retail – Stock Levels decreased by -9080.0%. Finland’s Retail – Stock Levels trend is down since the current value of 0.8 is lower than the 12 month moving average of 7.48333.Finland’s Retail – Business activity expectations (next 3 months) decreased to -11.1 by -5174.0% on January 2021 from -23.0 in the previous . On a year on year basis Finland’s Retail – Business activity expectations (next 3 months) decreased by -17255.0%. Finland’s Retail – Business activity expectations (next 3 months) trend is down since the current value of -11.1 is lower than the 12 month moving average of -10.2083.Finland’s Retail – Employment expectations (next 3 months) icnreased to -15.7 by 828.0% on January 2021 from -14.5 in the previous . On a year on year basis Finland’s Retail – Employment expectations (next 3 months) increased by 16167.0%. Finland’s Retail – Employment expectations (next 3 months) trend is down since the current value of -15.7 is lower than the 12 month moving average of -12.9167.Finland’s retail sales MoM decreased to 1.3 by -192.86% on August 2020 from -1.4 in the previous Monthly. On a year on year basis Finland’s retail sales MoM increased by 62.5%. Finland’s retail sales MoM trend is down since the current value of 1.3 is lower than the 12 month moving average of 0.441667.
Finland Construction Sector
Construction Activity | Actual | Previous | M/M% | Y/Y% | Trend | Slope | ZS5Y | Update |
---|---|---|---|---|---|---|---|---|
Construction sector | -8.6 | -17.9 | -0.519553 | -0.627706 | 1.0 | 1.0 | 0.616667 | 2021-04-01 |
Construction - Current Order Books | -19.3 | -20.4 | -0.0539216 | 0.312925 | 1.0 | -1.0 | 0.816667 | 2021-04-01 |
Construction - Prices over next 3 months | -8.3 | -30.2 | -0.725166 | -0.831984 | 1.0 | 1.0 | 0.4 | 2021-04-01 |
Construction - Employment over next 3 months | 2 | -15.5 | -1.12903 | -1.06329 | 1.0 | 1.0 | 0.45 | 2021-04-01 |
building permits | 4634 | 2113 | 119.31 | 97.36 | UP | UP | 83.33 | 2022-06-11 |
housing starts | 2752 | 3225 | -0.146667 | -0.0206406 | -1.0 | -1.0 | 0.316667 | 2021-02-28 |
Construction - Building Activity (past 3 months) | -10.2 | -16.5 | -0.381818 | -0.177419 | 1.0 | 1.0 | 0.633333 | 2021-04-01 |
Construction - Factors Limiting (None) | 34.2 | 33.4 | 0.0239521 | 0.0654206 | -1.0 | 1.0 | 0.5 | 2021-04-01 |
Construction - Factors Limiting (Insufficient Demand) | 38 | 36.8 | 0.0326087 | 0.371841 | -1.0 | 1.0 | 0.783333 | 2021-04-01 |
Construction - Factors Limiting (Weather) | 0.9 | 0.6 | 0.5 | -5.5 | -1.0 | 1.0 | 0.1 | 2021-04-01 |
Construction - Factors Limiting (Shortage of labour force) | 24.8 | 22.9 | 0.0829694 | -0.132867 | 1.0 | -1.0 | 0.35 | 2021-04-01 |
Construction - Factors Limiting (Shortage of material - equipment) | 7.8 | 7.8 | 0 | 0.114286 | 1.0 | 1.0 | 0.6 | 2021-04-01 |
Construction - Factors Limiting (Other) | 2.6 | 4.7 | -0.446809 | -0.904059 | -1.0 | -1.0 | 0.0166667 | 2021-04-01 |
Construction - Factors Limiting (Financial Constraints) | 7.7 | 8.1 | -0.0493827 | -0.3125 | -1.0 | -1.0 | 0.2 | 2021-04-01 |
Finland’s Construction sector icnreased to -21.0 by 2353.0% on January 2021 from -17.0 in the previous . On a year on year basis Finland’s Construction sector decreased by -40000.0%. Finland’s Construction sector trend is down since the current value of -21.0 is lower than the 12 month moving average of -12.25.Finland’s Construction – Current Order Books icnreased to -29.0 by 357.0% on January 2021 from -28.0 in the previous . On a year on year basis Finland’s Construction – Current Order Books decreased by -51429.0%. Finland’s Construction – Current Order Books trend is down since the current value of -29.0 is lower than the 12 month moving average of -15.6667.Finland’s Construction – Prices over next 3 months decreased to -34.0 by -1905.0% on January 2021 from -42.0 in the previous . On a year on year basis Finland’s Construction – Prices over next 3 months increased by 4167.0%. Finland’s Construction – Prices over next 3 months trend is down since the current value of -34.0 is lower than the 12 month moving average of -36.0.Finland’s Construction – Employment over next 3 months icnreased to -12.0 by 10000.0% on January 2021 from -6.0 in the previous . On a year on year basis Finland’s Construction – Employment over next 3 months decreased by -27143.0%. Finland’s Construction – Employment over next 3 months trend is down since the current value of -12.0 is lower than the 12 month moving average of -10.4167.Finland’s building permits icnreased to 3052.0 by 208.28% on August 2020 from 990.0 in the previous Monthly. On a year on year basis Finland’s building permits increased by 15.17%. Finland’s building permits trend is down since the current value of 3052.0 is lower than the 12 month moving average of 2946.83.Finland’s housing starts icnreased to 3037.0 by 6.86% on August 2020 from 2842.0 in the previous Monthly. On a year on year basis Finland’s housing starts decreased by -22.37%. Finland’s housing starts trend is down since the current value of 3037.0 is lower than the 12 month moving average of 3206.25.Finland’s Construction – Building Activity (past 3 months) icnreased to -32.0 by 5238.0% on January 2021 from -21.0 in the previous . On a year on year basis Finland’s Construction – Building Activity (past 3 months) decreased by -39091.0%. Finland’s Construction – Building Activity (past 3 months) trend is down since the current value of -32.0 is lower than the 12 month moving average of -11.5833.Finland’s Construction – Factors Limiting (None) icnreased to 35.0 by 606.0% on January 2021 from 33.0 in the previous . Finland’s Construction – Factors Limiting (None) trend is down since the current value of 35.0 is lower than the 12 month moving average of 35.3333.Finland’s Construction – Factors Limiting (Insufficient Demand) decreased to 41.0 by -1087.0% on January 2021 from 46.0 in the previous . On a year on year basis Finland’s Construction – Factors Limiting (Insufficient Demand) increased by 1081.0%. Finland’s Construction – Factors Limiting (Insufficient Demand) trend is down since the current value of 41.0 is lower than the 12 month moving average of 34.4167.Finland’s Construction – Factors Limiting (Weather) decreased to -1.0 by -20000.0% on January 2021 from 1.0 in the previous . On a year on year basis Finland’s Construction – Factors Limiting (Weather) decreased by -20000.0%. Finland’s Construction – Factors Limiting (Weather) trend is down since the current value of -1.0 is lower than the 12 month moving average of 0.25.Finland’s Construction – Factors Limiting (Shortage of labour force) icnreased to 25.0 by 3889.0% on January 2021 from 18.0 in the previous . On a year on year basis Finland’s Construction – Factors Limiting (Shortage of labour force) decreased by -2188.0%. Finland’s Construction – Factors Limiting (Shortage of labour force) trend is down since the current value of 25.0 is lower than the 12 month moving average of 26.6667.Finland’s Construction – Factors Limiting (Shortage of material / equipment) icnreased to 5.0 by 15000.0% on January 2021 from 2.0 in the previous . On a year on year basis Finland’s Construction – Factors Limiting (Shortage of material / equipment) decreased by -1667.0%. Finland’s Construction – Factors Limiting (Shortage of material / equipment) trend is down since the current value of 5.0 is lower than the 12 month moving average of 5.25.Finland’s Construction – Factors Limiting (Other) icnreased to 7.0 by 4000.0% on January 2021 from 5.0 in the previous . On a year on year basis Finland’s Construction – Factors Limiting (Other) decreased by -1250.0%. Finland’s Construction – Factors Limiting (Other) trend is down since the current value of 7.0 is lower than the 12 month moving average of 11.8333.Finland’s Construction – Factors Limiting (Financial Constraints) On a year on year basis Finland’s Construction – Factors Limiting (Financial Constraints) increased by 3750.0%. Finland’s Construction – Factors Limiting (Financial Constraints) trend is down since the current value of 11.0 is lower than the 12 month moving average of 9.33333.
Finland GDP
Actual | Previous | M/M% | Y/Y% | Trend | Slope | ZS5Y | Update | |
---|---|---|---|---|---|---|---|---|
Real GDP | 59013 | 58707 | 0.52 | 15.49 | UP | UP | 100 | 2022-06-06 |
gdp growth annual | 4.3 | 2.9 | 48.28 | 975 | UP | UP | 90 | 2022-05-15 |
gdp | 268.761 | 275.894 | -0.0258541 | 0.0496304 | 1.0 | 1.0 | 0 | 2019-01-31 |
gdp growth | 0.4 | 0.6 | -33.33 | 33.33 | UP | UP | 61.67 | 2022-05-15 |
Finland’s Real GDP icnreased to 50151.0 by 3.94% on May 2020 from 48252.0 in the previous Quarterly. On a year on year basis Finland’s Real GDP increased by 0.28%. Finland’s Real GDP trend is down since the current value of 50151.0 is lower than the 12 month moving average of 50668.8.Finland’s gdp growth annual decreased to -2.7 by -56.45% on July 2020 from -6.2 in the previous Quarterly. On a year on year basis Finland’s gdp growth annual decreased by -208.0%. Finland’s gdp growth annual trend is down since the current value of -2.7 is lower than the 12 month moving average of 0.258333.Finland’s gdp decreased to 268.761 by -2.59% on January 2019 from 275.894 in the previous Yearly. On a year on year basis Finland’s gdp increased by 4.96%. Finland’s gdp trend is down since the current value of 268.761 is lower than the 12 month moving average of 261.699.Finland’s gdp growth decreased to 3.3 by -184.62% on July 2020 from -3.9 in the previous Quarterly. On a year on year basis Finland’s gdp growth increased by 725.0%. Finland’s gdp growth trend is down since the current value of 3.3 is lower than the 12 month moving average of -0.0166667.
Finland inflation
Actual | Previous | M/M% | Y/Y% | Trend | Slope | ZS5Y | Update | |
---|---|---|---|---|---|---|---|---|
inflation cpi | 7 | 5.7 | 22.81 | 233.33 | UP | UP | 100 | 2022-06-14 |
core inflation rate | 3.8 | 2.8 | 35.71 | 216.67 | UP | UP | 100 | 2022-06-06 |
consumer price index cpi | 112.76 | 111.3 | 1.31 | 7.08 | UP | UP | 100 | 2022-06-14 |
Producer Price Index | 138.8 | 135.5 | 2.44 | 29.12 | UP | UP | 33.33 | 2022-05-23 |
PPI Index | 31.7 | 29.2 | 8.56 | 183.04 | UP | UP | 100 | 2022-06-24 |
Finland’s inflation cpi decreased to 0.2 by -66.67% on August 2020 from 0.6 in the previous Monthly. On a year on year basis Finland’s inflation cpi decreased by -75.0%. Finland’s inflation cpi trend is down since the current value of 0.2 is lower than the 12 month moving average of 0.583333.Finland’s core inflation rate icnreased to 0.4 by 33.33% on October 2020 from 0.3 in the previous Monthly. On a year on year basis Finland’s core inflation rate decreased by -55.56%. Finland’s core inflation rate trend is down since the current value of 0.4 is lower than the 12 month moving average of 0.508333.Finland’s consumer price index cpi decreased to 103.7 by -0.1% on November 2020 from 103.8 in the previous Monthly. On a year on year basis Finland’s consumer price index cpi increased by 0.19%. Finland’s consumer price index cpi trend is down since the current value of 103.7 is lower than the 12 month moving average of 103.529.Finland’s Producer Price Index icnreased to 101.2 by 0.7% on November 2020 from 100.5 in the previous Monthly. On a year on year basis Finland’s Producer Price Index decreased by -95.04%. Finland’s Producer Price Index trend is down since the current value of 101.2 is lower than the 12 month moving average of 1643.89.Finland’s PPI Index decreased to -4.6 by -14.81% on November 2020 from -5.4 in the previous Monthly. On a year on year basis Finland’s PPI Index increased by 475.0%. Finland’s PPI Index trend is down since the current value of -4.6 is lower than the 12 month moving average of -4.475.
Finland Government Policy
Actual | Previous | M/M% | Y/Y% | Trend | Slope | ZS5Y | Update | |
---|---|---|---|---|---|---|---|---|
government budget | -2.6 | -5.5 | -52.73 | 4 | Down | Down | 0 | 2022-05-23 |
Government budget | 370.5 | -281.1 | -2.31804 | -2.29139 | 1.0 | 1.0 | 0.116667 | 2021-05-31 |
government revenues | 5399.8 | 4285.2 | 0.260105 | 0.139415 | 1.0 | 1.0 | 0.866667 | 2021-05-31 |
fiscal expenditure | 4566 | 5353 | -0.14702 | -0.0612278 | -1.0 | -1.0 | 0.0833333 | 2021-04-30 |
Finland’s Government budget icnreased to -1448.5 by 7.27% on October 2020 from -1350.3 in the previous Monthly. On a year on year basis Finland’s Government budget increased by 39.61%. Finland’s Government budget trend is down since the current value of -1448.5 is lower than the 12 month moving average of -760.617.Finland’s government revenues icnreased to 4087.7 by 3.24% on August 2020 from 3959.6 in the previous Monthly. On a year on year basis Finland’s government revenues increased by 3.44%. Finland’s government revenues trend is down since the current value of 4087.7 is lower than the 12 month moving average of 4205.88.Finland’s fiscal expenditure decreased to 4483.6 by -17.69% on August 2020 from 5447.5 in the previous Monthly. On a year on year basis Finland’s fiscal expenditure increased by 9.82%. Finland’s fiscal expenditure trend is down since the current value of 4483.6 is lower than the 12 month moving average of 4875.77.
Finland Monetary Policy
Actual | Previous | M/M% | Y/Y% | Trend | Slope | ZS5Y | Update | |
---|---|---|---|---|---|---|---|---|
interest rate | 0.05 | 0.05 | 0 | 0 | 1.0 | -1.0 | 0.791667 | 2016-03-09 |
central bank balance sheet | 631.79 | 644.1 | -1.91 | 19.52 | UP | UP | 73.33 | 2022-06-06 |
banks balance sheet | 293401 | 283268 | 3.58 | 20.11 | UP | UP | 100 | 2022-06-11 |
money supply m0 | 27438.3 | 27217.4 | 0.81 | 8.89 | UP | UP | 100 | 2022-06-06 |
money supply m1 | 183870 | 184993 | -0.61 | 5.23 | UP | UP | 95 | 2022-06-06 |
money supply m2 | 194586 | 195509 | -0.47 | 4.72 | UP | UP | 96.67 | 2022-06-06 |
money supply m3 | 237645 | 240557 | -1.21 | 4.83 | UP | UP | 95 | 2022-06-06 |
Finland’s interest rate Finland’s interest rate trend is down since the current value of 0.05 is lower than the 12 month moving average of 0.05.Finland’s central bank balance sheet icnreased to 555.29 by 7.08% on November 2020 from 518.59 in the previous Monthly. On a year on year basis Finland’s central bank balance sheet increased by 8.43%. Finland’s central bank balance sheet trend is down since the current value of 555.29 is lower than the 12 month moving average of 742.083.Finland’s banks balance sheet decreased to 207211.0 by -1.57% on October 2020 from 210523.0 in the previous Monthly. On a year on year basis Finland’s banks balance sheet increased by 16.76%. Finland’s banks balance sheet trend is down since the current value of 207211.0 is lower than the 12 month moving average of 189416.0.Finland’s money supply m2 decreased to 182379.0 by -0.85% on October 2020 from 183942.0 in the previous Monthly. On a year on year basis Finland’s money supply m2 increased by 13.81%. Finland’s money supply m2 trend is down since the current value of 182379.0 is lower than the 12 month moving average of 173281.0.
Finland Employment
Actual | Previous | M/M% | Y/Y% | Trend | Slope | ZS5Y | Update | |
---|---|---|---|---|---|---|---|---|
EEI - Employment Composite | 108.4 | 93.9 | 0.15442 | 0.56196 | 1.0 | 1.0 | 1 | 2021-04-01 |
unemployment rate | 7.9 | 6.9 | 14.49 | -2.47 | UP | Down | 66.67 | 2022-06-22 |
youth unemployment rate | 16.9 | 16.2 | 4.32 | -23.87 | UP | Down | 53.33 | 2022-05-23 |
long term unemployment rate | 1.7 | 1.4 | 0.214286 | -0.15 | 1.0 | -1.0 | 0.441667 | 2021-01-01 |
Finland’s EEI – Employment Composite icnreased to 87.2 by 468.0% on January 2021 from 83.3 in the previous . On a year on year basis Finland’s EEI – Employment Composite decreased by -1526.0%. Finland’s EEI – Employment Composite trend is down since the current value of 87.2 is lower than the 12 month moving average of 90.6583.Finland’s EEI – Employment Composite icnreased to 87.2 by 468.0% on January 2021 from 83.3 in the previous . On a year on year basis Finland’s EEI – Employment Composite decreased by -1526.0%. Finland’s EEI – Employment Composite trend is down since the current value of 87.2 is lower than the 12 month moving average of 90.6583.Finland’s unemployment rate decreased to 6.9 by -6.76% on November 2020 from 7.4 in the previous Monthly. On a year on year basis Finland’s unemployment rate increased by 16.95%. Finland’s unemployment rate trend is down since the current value of 6.9 is lower than the 12 month moving average of 7.60833.Finland’s youth unemployment rate decreased to 14.3 by -20.56% on September 2020 from 18.0 in the previous Monthly. Finland’s youth unemployment rate trend is down since the current value of 14.3 is lower than the 12 month moving average of 19.9083.Finland’s long term unemployment rate icnreased to 1.3 by 18.18% on March 2020 from 1.1 in the previous Quarterly. On a year on year basis Finland’s long term unemployment rate decreased by -38.1%. Finland’s long term unemployment rate trend is down since the current value of 1.3 is lower than the 12 month moving average of 1.38333.
Finland Trade & Capital Flows
Actual | Previous | M/M% | Y/Y% | Trend | Slope | ZS5Y | Update | |
---|---|---|---|---|---|---|---|---|
current account | -2286 | -1222 | 87.07 | 249.54 | Down | Down | 3.33 | 2022-06-14 |
current account to gdp | 0.3 | -0.3 | -2 | -0.857143 | 1.0 | -1.0 | 0 | 2020-01-31 |
exports | 6600 | 6943 | -4.94 | 48.31 | UP | UP | 96.67 | 2022-06-11 |
imports | 7500 | 8339 | -10.06 | 33.93 | UP | UP | 97.5 | 2022-06-11 |
balance of trade | -900 | -1396 | -35.53 | 252.94 | Down | Down | 6.67 | 2022-06-11 |
Finland’s current account icnreased to 535.0 by 409.52% on October 2020 from 105.0 in the previous Monthly. On a year on year basis Finland’s current account increased by 4.9%. Finland’s current account trend is down since the current value of 535.0 is lower than the 12 month moving average of -8.41667.Finland’s current account to gdp decreased to -0.8 by -57.89% on January 2019 from -1.9 in the previous Yearly. On a year on year basis Finland’s current account to gdp decreased by -121.62%. Finland’s current account to gdp trend is down since the current value of -0.8 is lower than the 12 month moving average of -0.666667.Finland’s exports icnreased to 5075.0 by 3.72% on October 2020 from 4893.2 in the previous Monthly. On a year on year basis Finland’s exports decreased by -11.84%. Finland’s exports trend is down since the current value of 5075.0 is lower than the 12 month moving average of 4749.96.Finland’s imports decreased to 5135.0 by -2.82% on October 2020 from 5283.9 in the previous Monthly. On a year on year basis Finland’s imports decreased by -11.35%. Finland’s imports trend is down since the current value of 5135.0 is lower than the 12 month moving average of 4965.8.Finland’s balance of trade decreased to -60.0 by -84.64% on October 2020 from -390.7 in the previous Monthly. On a year on year basis Finland’s balance of trade increased by 68.54%. Finland’s balance of trade trend is down since the current value of -60.0 is lower than the 12 month moving average of -215.842.
Finland Reserves
Actual | Previous | M/M% | Y/Y% | Trend | Slope | ZS5Y | Update | |
---|---|---|---|---|---|---|---|---|
foreign exchange reserves | 15151 | 15427 | -1.79 | 35.64 | UP | UP | 98.33 | 2022-06-22 |
gold reserves | 49.14 | 49.14 | 0 | 0 | 1.0 | -1.0 | 0.516667 | 2020-08-01 |
Finland’s foreign exchange reserves decreased to 9700.0 by -5.01% on November 2020 from 10212.0 in the previous Monthly. On a year on year basis Finland’s foreign exchange reserves decreased by -4.85%. Finland’s foreign exchange reserves trend is down since the current value of 9700.0 is lower than the 12 month moving average of 10113.8.Finland’s gold reserves icnreased to 49.14 by 0.08% on July 2020 from 49.1 in the previous Quarterly. Finland’s gold reserves trend is down since the current value of 49.14 is lower than the 12 month moving average of 49.1133.Finland’s government debt icnreased to 123281.0 by 2.57% on October 2020 from 120192.0 in the previous Monthly. On a year on year basis Finland’s government debt increased by 17.36%. Finland’s government debt trend is down since the current value of 123281.0 is lower than the 12 month moving average of 117219.0.Finland’s government debt to gdp decreased to 59.4 by -0.34% on January 2019 from 59.6 in the previous Yearly. On a year on year basis Finland’s government debt to gdp increased by 74.71%. Finland’s government debt to gdp trend is down since the current value of 59.4 is lower than the 12 month moving average of 53.9417.Finland’s external debt decreased to 566210.0 by -1.38% on May 2020 from 574162.0 in the previous Quarterly. On a year on year basis Finland’s external debt increased by 34.23%. Finland’s external debt trend is down since the current value of 566210.0 is lower than the 12 month moving average of 507604.0.
Finland Debt
Debt | Actual | Previous | M/M% | Y/Y% | Trend | Slope | ZS5Y | Update |
---|---|---|---|---|---|---|---|---|
government debt | 126111 | 125373 | 0.00588644 | 0.0702701 | 1.0 | 1.0 | 0.8 | 2021-05-31 |
government debt to gdp | 65.8 | 69 | -4.64 | 57.79 | UP | UP | 0 | 2022-04-29 |
external debt | 588467 | 515670 | 14.12 | 8.98 | UP | UP | 98.33 | 2022-06-24 |
Finland’s government debt icnreased to 123281.0 by 2.57% on October 2020 from 120192.0 in the previous Monthly. On a year on year basis Finland’s government debt increased by 17.36%. Finland’s government debt trend is down since the current value of 123281.0 is lower than the 12 month moving average of 117219.0.Finland’s government debt to gdp decreased to 59.4 by -0.34% on January 2019 from 59.6 in the previous Yearly. On a year on year basis Finland’s government debt to gdp increased by 74.71%. Finland’s government debt to gdp trend is down since the current value of 59.4 is lower than the 12 month moving average of 53.9417.Finland’s external debt decreased to 566210.0 by -1.38% on May 2020 from 574162.0 in the previous Quarterly. On a year on year basis Finland’s external debt increased by 34.23%. Finland’s external debt trend is down since the current value of 566210.0 is lower than the 12 month moving average of 507604.0.
Finland Banking activity
Fiscal Policy | Actual | Previous | M/M% | Y/Y% | Trend | Slope | ZS5Y | Update |
---|---|---|---|---|---|---|---|---|
interbank rate | -0.54 | -0.54 | 0 | 0 | -1.0 | -1.0 | 0.575 | 2021-05-31 |
bank lending rate | 4.04 | 4.12 | -0.0194175 | -0.0444203 | -1.0 | -1.0 | 0.283333 | 2021-05-31 |
loans to private sector | 100831 | 100427 | 0.4 | 3.77 | UP | UP | 100 | 2022-06-06 |
Finland’s interbank rate On a year on year basis Finland’s interbank rate decreased by -9.09%. Finland’s interbank rate trend is down since the current value of -0.44 is lower than the 12 month moving average of -0.423333.Finland’s bank lending rate decreased to 4.15 by -0.72% on October 2020 from 4.18 in the previous Monthly. On a year on year basis Finland’s bank lending rate decreased by -1.05%. Finland’s bank lending rate trend is down since the current value of 4.15 is lower than the 12 month moving average of 4.23957.Finland’s loans to private sector icnreased to 97316.0 by 0.13% on October 2020 from 97194.0 in the previous Monthly. On a year on year basis Finland’s loans to private sector increased by 7.46%. Finland’s loans to private sector trend is down since the current value of 97316.0 is lower than the 12 month moving average of 95045.8.
Finland macroeconomic model analysis
The two most important economic indicators of the Finland economy are real economic growth expectations and inflation. MacroVar uses Finland Manufacturing ESI Order Books to gauge economic growth expectations and Finland Manufacturing ESI Selling Price expectations of next months to gauge inflation expectations. Finland’s economy is healthy when it generates stable economic growth with low inflation. Policymakers (the government and the central bank) use fiscal and monetary policy to inject liquidity during slowdowns (to solve weak economic growth) and withdraw liquidity from an overheating economy (to solve high inflation).
The four economic environments
There are 4 economic environments based on economic growth and inflationary conditions. Financial assets are affected by economic growth and inflation expectations as explained in the diagram below.
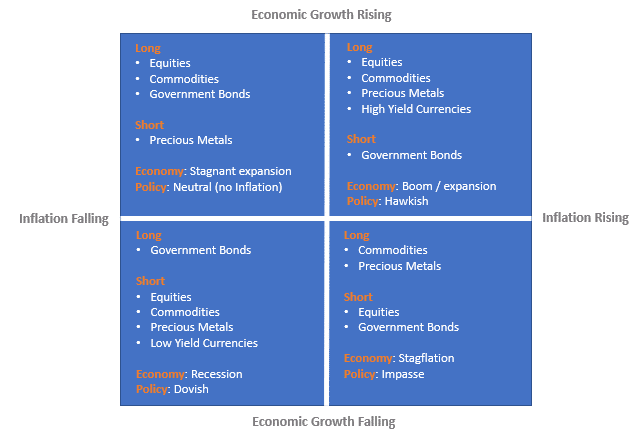
- Inflation boom: Accelerating Economic growth with Rising inflation – Monetary Policy response: Hawkish
- Stagflation: Slowing Economic Growth with Rising Inflation – Monetary Policy response: Dilemma
- Disinflation boom: Accelerating Economic growth with Slowing Inflation – Monetary Policy response: Neutral
- Deflation Bust: : Slowing Economic Growth with Falling Inflation – Monetary Policy response: Dovish