Choosing the Right Financial Advisor: A Data-Driven Approach
The aim of an investor should be to achieve sustainable growth of his capital while protecting it during market corrections.
The most important mistake amateur investors make is they select financial advisors based only on their past short-term returns while ignoring the volatility of returns.
Investors should select a financial advisor based on his past performance which is summarized by two elements: high average returns and low volatility.
This guide will help you grasp how to analyze a financial advisor’s past performance in order to conclude whether his performance suits your investment profile.
Financial Advisor selection criteria
To examine a financial advisor’s performance, you must analyse the following characteristics:
Historical Annual Returns
Average annual return (AAR) is the percentage historical return of a financial advisor’s typical investment portfolio. The advisor’s annualized return must be examined for long historical periods of at least 10 years to confirm how the advisor performed during different market environments like Economic Growth & Recessions.
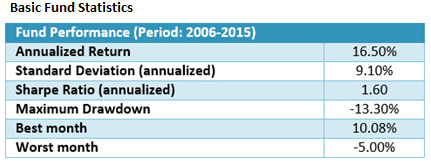
In this example the financial advisor generated on average during the period of 2006 to 2015 a 16.5% annual return. However, annual returns is not the only criterion to select an advisor.
Volatility
Volatility describes the degree to which an investment’s value moves up and down. This is the investment’s risk. Investors should select investments with the highest return possible and the lowest volatility. In the example above, the advisor’s typical portfolio had an annualized volatility of (also called standard deviation of 9.10%). Combined with the annual returns, on a typical year you should expect annual returns to fall within a range of 7.4% (16.5%-9.10%) and 25.6% (16.5%+9.10%).
Maximum Drawdown
An investment strategy suffers a drawdown when it loses money. Maximum drawdown measures the largest single drop from peak to bottom in the investment’s value. Investors in a fund with a max drawdown of 50% saw their portfolios lose half of their value. You should select financial advisor which have historically generated a low maximum drawdown. This is an indication, that the financial advisor controls the portfolio’s risk optimally. Investing in financial advisors which have experienced a maximum drawdown between 5% and 20% are considered safe.
Performance consistency
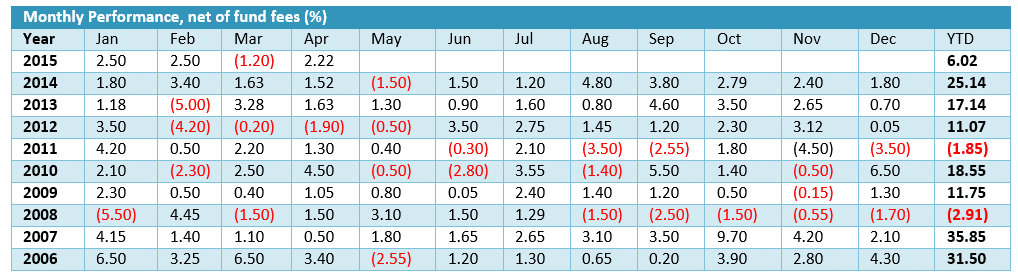
A financial advisor’s performance should be examined for long historical periods of at least 10 years to confirm how the advisor performed during different market environments (Growth, Recession) and adverse market conditions.
Market crashes: Special attention must be given on how the investment performed during market crisis like 2000 dot-com bubble, 2008-2009 crash etc.
Longer periods of historical performance often guarantee similar future investment performance irrespective of the market environment.
Comparing investment strategies performance
Before selecting a financial advisor, you should compare his historical performance with benchmarks like the US stock market index (S&P 500), passive investment portfolio and financial advisors. You should compare the financial advisor’s Sharpe ratio not just his annual performance to get an overview of the risk return strategy profile.
The Sharpe ratio helps investors understand the return a financial advisor has generated compared to the risk he took. Good safe investment strategies generate Sharpe ratios between 1.0 and 2.0.
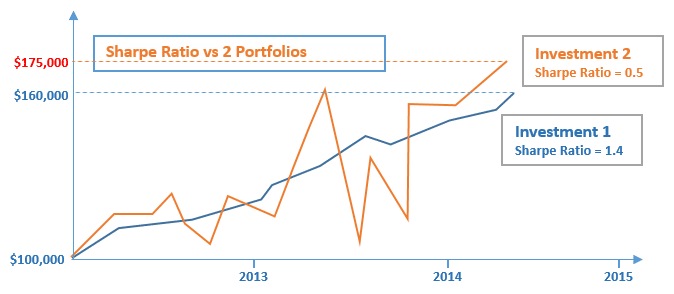
Assume you had to choose between two financial advisors with the performance displayed above. Although financial advisor 2 has generated a portfolio with a higher ending value than advisor 1, he took a much higher risk displayed by the ups and downs of his portfolio (volatility and drawdown) than financial advisor 1. As a result, financial advisor’s 1 portfolio has a Sharpe ratio 3 times higher than financial advisor’s 2. Hence, financial advisor 1 is preferred.
In the example above, during the second half of 2013, financial advisor’s 2 portfolio dropped from $160,000 to $105,000 losing 35% of its value. On the other hand, financial advisor 1 experienced his biggest drawdown in the end of 2013 losing just 4.5% of its value.
Investment costs
An investment’s net performance must be examined after all costs have been deducted. The higher the cost of an investment, the greater the erosion of an investor’s returns is and hence the more difficult it is to generate profits.
Various types of investment costs exist, including expense ratios, sales loads, transaction fees, and advisor fees. While certain fees are essential for covering the expenses associated with investment management, excessive fees can significantly erode your long-term returns.
- Financial advisors charge a flat financial advisor fee covering the whole advisory, which is generally based on a percentage of assets under management (AUM). Common values are between 1-2% of AUM. Keep in mind that most investors are not compensated for the fees paid to financial advisors.
- Mutual funds embed their costs into what investors see as their net performance.
- Investors in individual securities (stocks, ETFs etc.) pay commissions for trade execution. When analysing a specific strategy, it is critical to examine the total trading costs. The 2 major variables to check are 1. The frequency of trading and 2. The cost per trade (typically $5-10).
One of the foremost concerns associated with excessive fees is their potential to hinder the accumulation of compound interest. Compound interest holds the capacity to yield substantial growth in your investment portfolio as time progresses. Nevertheless, excessive fees diminish your overall investment returns and, consequently, diminish the long-term advantages of compound interest.
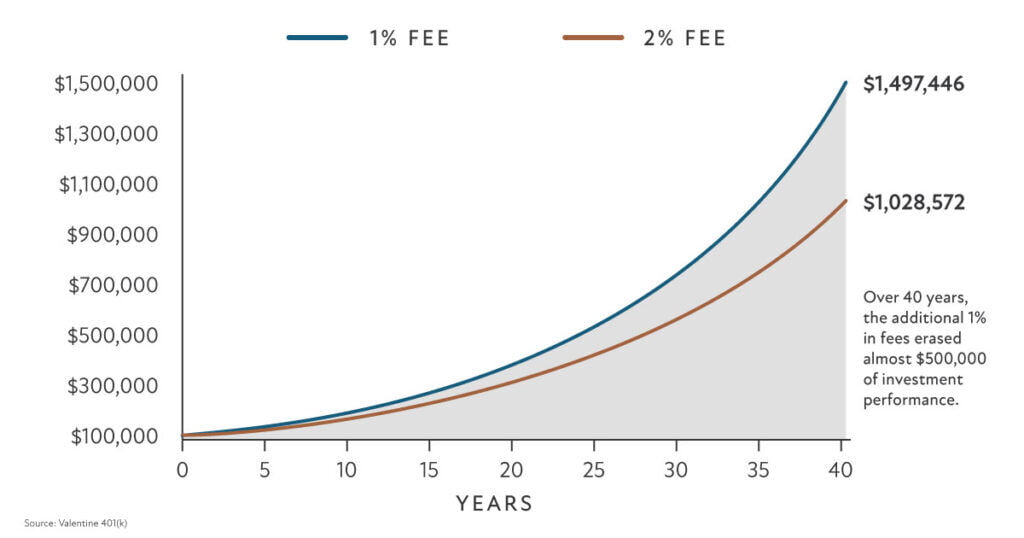
Advisory fees refer to the charges imposed by financial advisors for the management of your investment portfolio. These fees are commonly calculated as a percentage of the total assets they oversee. For instance, if an advisor charges an annual rate of 1.00%, they would bill you $1,000 per year to handle a $100,000 portfolio. Many advisors employ a tiered fee structure, meaning that the more assets they manage, the lower the overall fee percentage.
It’s crucial to inquire with your financial advisor whether they are also receiving income from the sale of other investment or insurance products, such as commissions. Ensuring that your financial advisor is motivated to enhance your portfolio’s growth rather than merely earning commissions is vital for your financial well-being and the establishment of a trustworthy, long-term relationship.
DIY Financial Advisor
You can avoid the advisory fees paid to the financial advisor and manage your investment portfolio by yourself using MacroVar portfolio investment tracker to select a portfolio investment based on the criteria described above and get notified when the asset allocation of the strategy changes to make the appropriate modifications on your investment portfolio.
You can also consider learning how to manage your investment portfolio as a professional active trader using MacroVar Free active trading methodology.