Fed Funds Forward curve
MacroVar analyses the Fed funds forward curve to monitor the market’s expectations for the Federal reserve’s future monetary policy actions (rate hikes/cuts) depending on the current dynamics of financial markets and macroeconomic indicators.
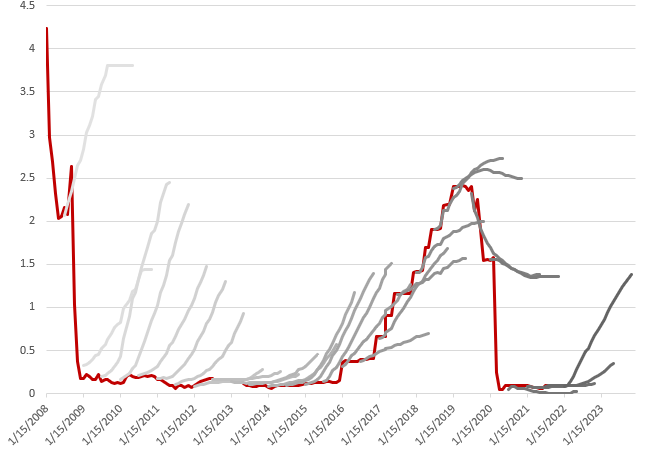
Currently the Fed Funds forward curve shows a peak of interest rates in the first quarter of 2024, and a steady reduction in FED rates.
Explore how to interpret the Fed Funds forward curve dynamics. Sign up using the form on the right to access MacroVar’s analytics, research and data of the Fed Funds Forward curve and all major financial markets and economies.
MacroVar presents the current shape of the Fed Funds curve compared to the Fed Funds curve in previous periods (1 week ago, 1month, 3 months, 6 months and 1 year). The shape of the Fed Funds forward curve which is assembled from Fed Fund futures provides estimates of the assumed path for the specific reference periods.
What is the Fed Funds forward curve
The Fed Funds forward curve, also known as the Federal Funds rate forward curve, is a graphical representation of the expected future path of the Federal Funds rate, which is the interest rate at which depository institutions (banks) lend reserve balances to other banks overnight. The Federal Funds rate is a key policy tool used by the Federal Reserve, the central bank of the United States, to influence monetary policy and manage the economy.
The Fed Funds forward curve is typically plotted as a series of data points that show the expected future Federal Funds rates at different points in time. These data points are derived from the prices of various financial instruments, such as Eurodollar futures contracts or interest rate swaps, which reflect market expectations for future interest rates.
The shape of the Fed Funds forward curve can provide insights into market expectations regarding the future direction of monetary policy. For example:
- Normal Curve: In a normal economic environment, the Fed Funds forward curve is typically upward-sloping, meaning that the expected interest rates in the future are higher than the current rates. This shape reflects the expectation that the central bank will raise interest rates over time to combat inflation or manage economic growth.
- Inverted Curve: An inverted Fed Funds forward curve occurs when the expected future interest rates are lower than the current rates. This shape can signal market expectations of an economic downturn or that the central bank may need to cut rates in the future to stimulate economic growth.
- Flat Curve: A flat Fed Funds forward curve suggests that the market expects interest rates to remain relatively stable in the future. This might indicate a period of economic stability or uncertainty about the future path of interest rates.
The Fed Funds forward curve is a valuable tool for financial market participants, economists, and policymakers as it provides a snapshot of market sentiment regarding future monetary policy and economic conditions. It can also influence the pricing of various financial products and impact investment and borrowing decisions in the broader economy.
Interpreting the Fed Funds Forward Curve dynamics
When the US economy is strong and inflation expectations are rising the market is expecting central banks to raise rates in order to decelerate economic and inflation expectations. Short-term interest rates like the Fed Funds are linked to the macroeconomic environment, fiscal and monetary policies and the financial markets (commodities).Hence, short term interest rates should be expected to rise and their related futures which are the 3-month Fed Funds futures should sell off (note: implied interest rate for futures is calculated as 100 minus the futures price). At the same time and since markets are interrelated, fixed income markets are linked the Yield Curve (10-year minus 3-month). The Yield curve steepens when growth expectations are rising and flattens when growth falls (MacroVar monitors all macroeconomic and financial factors which are leading indicators of growth expectations).
When central banks set rates correctly, we should expect smooth slope implied curve in the short term interest rate futures markets.
Highly sloping implied rate curves imply that the central bank reacted too late, the economy has overheated causing inflationary pressures and the futures markets imply aggressive interest rate hikes.
An Inverted implied rate curve implies that the central bank reacted too late, hence has to be more aggressive in order to combat inflation pressures, causing the business cycle to shorten, a possible recession due to early fast hikes and interest rate cuts later on to combat an impeding recession.
The Federal reserves's FOMC meetings affect these markets to a large extent. When the FED becomes more hawkish (tendency to raise rates) or dovish by either adjusting interest rates and/or use QE/QT, it affects the Short-term interest rates futures markets directly.
When the US 2-year bond yield which is determined by market forces falls below the FED refinancing rate it implies the market expects FED to cut interest rates in the short-term future in order to boost the economy which is currently weak.