Interest rates curve
MacroVar analyses the US interest rates curve to provide insights for making investment decisions and assessing the overall health of the economy.
Currently the US interest rates curve is disinverting implying an impeding recession.
Sign up using the form on the right to access MacroVar’s analytics, research and data of the interest rates curve and all major financial markets and economies.
What is the interest rate curve
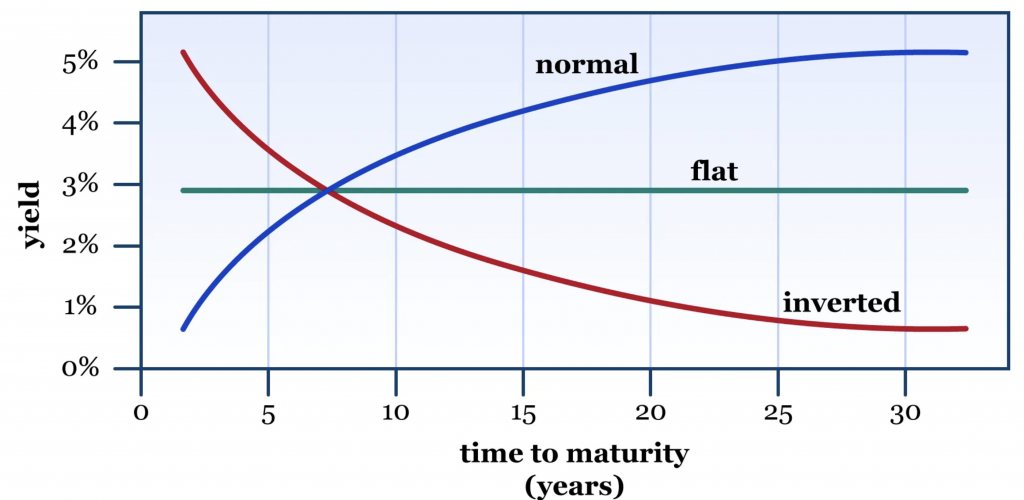
The interest rate curve is a line that plots yields (or interest rates) of bonds having equal credit quality but differing maturity dates. Bond maturities range from 3 months to 30 years.
The benchmark interest rate curve monitored closely for all economies is the spread between the 10-year bond and the 2-year bond. The 10-year to 2-year interest rates curve predicts economic conditions 4-5 years out.
The short-end (the 2-year bond) of the interest rates curve is driven by market expectations of central bank’s actions while the long-end (the 10-year bond) is driven by the market’s expectations of future economic conditions and the inflation outlook.
The US interest rates curve is one of the most important leading indicators used to predict the US economy and markets. The full US interest rates curve (the spread between the US 10-year bond and the Fed funds target rate) is often leading or lagging other leading indicators of the economy and markets. The most important leading indicators to gauge US markets and the economy are the US interest rates curve against are the US ISM Manufacturing PMI, the S&P 500 stock market index, the US CDX IG credit risk index and the VIX equity risk index. These few leading indicators when combined, provide you an overall outlook of the US economy and financial markets.