Treasury yield curve
MacroVar analyses the US treasury yield curve to provide insights for making investment decisions and assessing the overall health of the economy.
Currently the US treasury yield curve is disinverting implying an impeding recession.
Sign up using the form on the right to access MacroVar’s analytics, research and data of the treasury yield curve and all major financial markets and economies.
What is the treasury yield curve
The treasury yield curve is a line that plots yields (or interest rates) of bonds having equal credit quality but differing maturity dates. Bond maturities range from 3 months to 30 years.
The benchmark interest rate curve monitored closely for all economies is the spread between the 10-year bond and the 2-year bond. The 10-year to 2-year treasury yield curve predicts economic conditions 4-5 years out.
The short-end (the 2-year bond) of the treasury yield curve is driven by market expectations of central bank’s actions while the long-end (the 10-year bond) is driven by the market’s expectations of future economic conditions and the inflation outlook.
The US treasury yield curve is one of the most important leading indicators used to predict the US economy and markets. The full US treasury yield curve (the spread between the US 10-year bond and the Fed funds target rate) is often leading or lagging other leading indicators of the economy and markets. The most important leading indicators to gauge US markets and the economy are the US treasury yield curve against are the US ISM Manufacturing PMI, the S&P 500 stock market index, the US CDX IG credit risk index and the VIX equity risk index. These few leading indicators when combined, provide you an overall outlook of the US economy and financial markets.
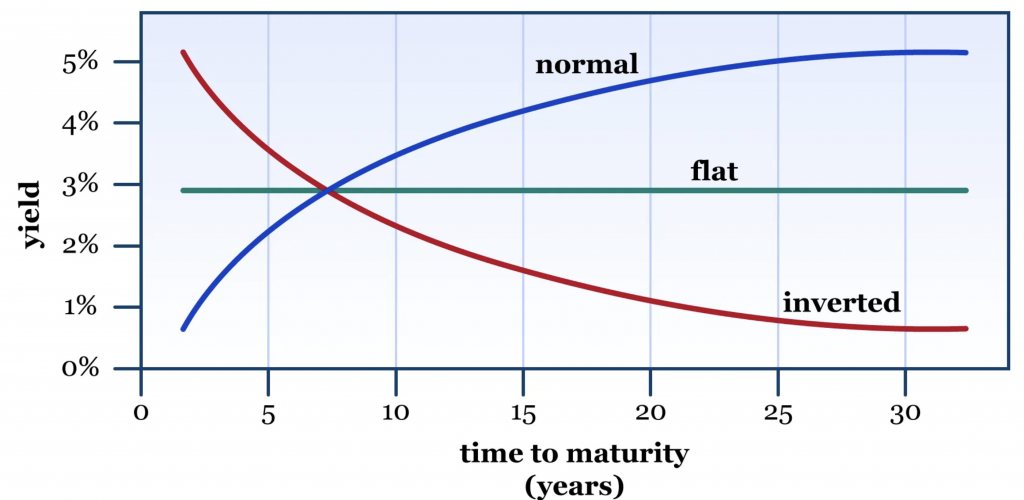
The yield curve typically has an upward-sloping shape, meaning that longer-term Treasury securities tend to have higher yields than shorter-term ones. This is because investors usually expect to be compensated with higher yields for locking in their money for longer periods, given the inherent risks and uncertainties associated with longer-term investments.
However, the shape of the yield curve can change over time, and various yield curve shapes may indicate different economic conditions and market expectations:
- Normal Yield Curve: In a healthy economy, the yield curve is typically upward-sloping, indicating that long-term interest rates are higher than short-term rates.
- Inverted Yield Curve: An inverted yield curve occurs when short-term interest rates are higher than long-term rates. This inversion is often seen as a warning sign of an economic downturn or recession, as it can signal that investors expect lower future interest rates and are seeking the safety of long-term bonds.
- Flat Yield Curve: A flat yield curve means that the yields on short-term and long-term Treasury securities are nearly the same. This can suggest uncertainty or expectations of economic changes.
- Steep Yield Curve: A steep yield curve indicates that the difference between short-term and long-term interest rates is increasing. It can signal expectations of economic growth and rising inflation.
The Federal Reserve’s monetary policy decisions, such as changes in the federal funds rate (the overnight lending rate between banks), can influence the shape of the yield curve. Additionally, market factors, economic indicators, and investor sentiment can all impact the yield curve’s shape.
Financial analysts and policymakers closely monitor the yield curve because it provides insights into the state of the economy, inflation expectations, and potential interest rate movements. An understanding of the yield curve can help investors make decisions about their bond portfolios and other investments.