Stock Markets Dynamics
MacroVar Stocks Dynamics Models
MacroVar models analyze global stock markets by analyzing multiple macroeconomic and financial factors affecting a specific stock market.
Individual stock analysis is currently outside MacroVar’s scope. However, individual stocks are highly correlated to general stock market performance. Hence, investors should follow a top-down approach when structuring a stock portfolio by first analyzing Global macroeconomic and market dynamics and then focusing on specific sectors and stocks. Checkout below analysis of how MacroVar models analyze Stock Markets. To get started select Stocks from the main menu of the dashboard page.
If you are new to stocks, click here for an introduction to stocks.
Top-Down Stock Analysis
MacroVar approach in analyzing stock markets starts from the global macroeconomic view, moving on to individual countries and then to individual sectors inside the stock markets.

The dynamics of each stock market is monitored in conjunction with the global market dynamics, and other markets.
MacroVar Stocks Factor Analysis
Stock Markets versus related markets
Macrovar models analyze in real-time the following relative factors which will be explained briefly in the next sections of this article.
- Stocks versus Bond Markets
- Stocks versus Credit Markets (CDS and corporate bonds)
- Stocks versus Macroeconomic PMI & ESI Surveys
- Stocks versus Credit Markets (CDS and corporate bonds)
Moreover, MacroVar monitors at least 200 factors specific to specific sectors. Some Examples are displayed below:
- Commodity related Stock Sectors versus commodities (E.g. Energy ETF sector (XLE) versus crude oil price)
- Banking related Stock Sectors vs Yield Curve dynamics (E.g. Bank ETF sector (KBE) vs US 2s10 Yield Curve)
- Real estate stock sectors vs Macroeconomic Indicators (E.g. HomeBuilders ETF sector (ITB) vs Building Permits & 30-Year US Mortage Rates)
- Stock Sectors versus Macroeconomic Surveys for specific sectors (Sources: Eurostat ESI, ZEW Institute, IFO)
- Stock Seasonality
Other Factors MacroVar monitors closely are:
- Style: Growth, Value, Momentum, Small Cap, low Volatility, High Dividend Yield
- Size versus Value: Large-Cap Value vs Growth, Mid-Cap Value vs Growth, Small-Cap Value vs Growth
Stocks Price Dynamics
MacroVar models also analyze stock sectors from a long-short perspective. Long-short equity is an investing strategy seeks to minimize market exposure while profiting from stock gains in the long positions, along with price declines in the short positions.
MacroVar models can be used to generate long/short trading ideas by using related Long / Short analysis of Country Stock Indices, Sector Indices and Macroeconomic Reports like the ESI & ISM Manufacturing and Services PMI reports. Other methods to identify long/short ideas is to compare P/E across different sectors and individual stocks.
Stocks Versus Market Risk
Investors need to monitor Global Market risk before deciding whether to be long, short or market neutral in a specific stock market, sector and specific stock. Moreover, Global market risk is important in defining a portfolio’s gross and net exposure The sections below briefly analyze what MacroVar models monitor to gauge Risk related to the stock market. You can monitor Global market risk conditions in the Risk Management section.
Equity Risk
MacroVar models monitor the most important indicators to gauge risk implied stock market volatility across US & European markets. The volatility index (VIX) monitors the implied volatility of the S&P 500 while the VSTOXX tracks the implied volatility of Euro Stoxx 50 stock index.
During low-risk environments, VIX, VSTOXX are low and their respective VIX futures curve are in contango. However, other factors are closely monitored to identify periods of market complacency which are often followed by market corrections. You can monitor MacroVar Volatility models in detail in the Risk Management section.
Credit Risk
Stocks are closely correlated with corporate bonds. Bond investors are often more sophisticated than stock investors. As a result, corporate bonds performance often decouples from stocks which very often predicts a correction period for stocks.
MacroVar monitors an extensive series of Credit Default Swaps and Corporate Bond indices however the most important ones to monitor are the Markit CDX IG and HY indexes for the US, the ITRAXX IG and HY for Europe and the CDX EM for Emerging Markets.
During low-risk environments the indicators mentioned above are low. It is important to monitor the momentum of the CDS indices vs S&P 500 and the VIX components.
You can monitor MacroVar Credit models in detail in the Credit Markets and Stock Market Risk monitors and quantitative models.
Stocks versus Global & Country Economic Growth Dynamics
Manufacturing and Services PMI for all countries combined with ESI surveys for European countries only are surveys based on corporations’ expectations on how the economy is performing.
They are leading indicators of how the individual economies are performing and hence are closely correlated with stocks.
However, sometimes there is divergence between the performance of PMIs and Stock Markets, which often lead to Stock Market corrections or recoveries.
MacroVar models closely monitor the dynamics between stocks markets and these macroeconomic indicators to identify divergences. You can find these in the Stock Markets section.
MacroVar Price Dynamics Models
Stock Market Breadth
MacroVar analysis monitors global flows into stock markets as a whole. Hence, MacroVar monitors the Stock Market Breadth across the 35 biggest stock markets in the world as well Stock Market Breadth of the US Stock markets.
MacroVar index (MV)
The MacroVar index is a synthetic variable derived by a combination of the Momentum, Trend and Bubble models described below. It ranges between -150 and +150. MacroVar displays signals schematically as follows:
The MacroVar index is a synthetic variable derived by a combination of the Momentum, Trend and Bubble models described below. It ranges between -150 and +150. MacroVar displays signals schematically as follows: Value currently 0 meaning that trend is flat.
Value is -25 meaning a strong -ve momentum is currently present.
Value is -50 meaning a strong -ve momentum is currently present.
Value is -75 meaning a strong -ve momentum and long-term is currently present.
Value is -100 meaning a strong -ve momentum and long-term is currently present.
Value is +25 meaning a strong +ve momentum is currently present.
Value is +50 meaning a strong +ve momentum is currently present.
Value is +75 meaning a strong +ve momentum and long-term is currently present.
Value is +100 meaning a strong +ve momentum and long-term is currently present.
Value is either +125 (when Momentum and Trend is +100) or -125 (when Momentum and Trend is -100) meaning that there is a moderate possibility of price reversal from the current trend.
Value is either +150 (when Momentum and Trend is +100) or -150 (when Momentum and Trend is -100) meaning that there is a very high probability of price reversal from the current trend.
MacroVar Momentum Model (M)
Momentum trading is used to capture moves in shorter timeframes than trends. Momentum is the relative change occurring in markets. Relative change is different to a trend. A long-term trend can be up but the short-term momentum of a specific market can be 0.
If a market moves down and then moves up and then moves back down the net relative change in price is 0. That means momentum is 0. A short-term positive momentum, with a long-term downtrend results in markets with no momentum.
MacroVar momentum signal ranges from -100 to +100. The market trend signal is derived as the mean value from 4 calculations for each asset. The timeframes monitored are the following:
- 1 Day (1 trading day)
- 1 Week (5 trading days)
- 1 Month (20 trading days)
- 3 Months (60 trading days)
For each timeframe, the following calculations are performed:
- Calculations of the return for the specific timeframe
- If return calculated is higher than 0, signal value 1 else signal value -1
Finally, the 4 values are aggregated daily.
A technical rollover is identified when MacroVar momentum strength indicator moves from positive to negative value or vice-versa. Value currently 0 meaning that momentum is flat.
Value is -25 meaning a weak -ve momentum is currently present.
Value is -50 meaning a strong -ve momentum is currently present.
Value is -75 meaning a strong -ve momentum is currently present.
Value is -100 meaning a strong -ve momentum is currently present.
Value is +25 meaning a strong +ve momentum is currently present.
Value is +50 meaning a strong +ve momentum is currently present.
Value is +75 meaning a strong -ve momentum is currently present.
Value is +100 meaning a strong -ve momentum is currently present.
MacroVar Trend model (T)
MacroVar Trend signal ranges from -100 to +100. The market trend signal is derived as the mean value from 8 calculations for each asset. The timeframes monitored are the following:
- 1-month (20 trading days)
- 3-months (60 trading days)
- 6-months (125 trading days)
- 1-year (250 trading days)
For each timeframe, the following calculations are performed:
- Closing price vs moving average (MA): if price greater than MA value is +1, else -1
- Moving average slope: if current MA is higher than previous MA, upward slope +1, else -1
MacroVar trend model can be used as a trend strength indicator. MacroVar trend strength values ranging between +75 and +100 or -75 and -100 show strong trend strength.
A technical rollover is identified when MacroVar trend strength indicator moves from positive to negative value or vice-versa. Value currently 0 meaning that trend is flat.
Value is -25 meaning a weak -ve trend is currently present.
Value is -50 meaning a strong -ve trend is currently present.
Value is -75 meaning a strong -ve trend is currently present.
Value is -100 meaning a strong -ve trend is currently present.
Value is +25 meaning a strong +ve trend is currently present.
Value is +50 meaning a strong +ve trend is currently present.
Value is +75 meaning a strong -ve trend is currently present.
Value is +100 meaning a strong -ve trend is currently present.
MacroVar Bubble model (B)
MacroVar bubble model monitors a financial asset’s price relative to its 252-day moving average to identify possible inflection point. Extreme moves often followed by price reversals have a high probability of occuring when MacroVar bubble indicator is greater than 2.5 or less than -2.5.
The MacroVar bubble model is calculated using the formula: Latest Price – (252-day Moving Average) / (252-day Standard Deviation). It represents a z-score and extreme values are greater than 2.5 and less than -2.5. Other thresholds include -3, +3. Value is higher than +2.5 or lower than -2.5 meaning that there is a moderate possibility of price reversal from the current trend.
Value is higher than +3 (when Momentum and Trend is +100) or -3 (when Momentum and Trend is -100) meaning that there is a very high probability of price reversal from the current trend.
Momentum vs Trend
A trend can last for day(s), weeks and even months and doesn’t necessarily need momentum to continue moving. Trend is a sustained directional movement over a time. Momentum typically refers to the building of energy in a particular direction. For example, as part of an overall trend up, the market might be experiencing a lot of momentum to the upside, whereas the market may be in an overall trend up, but lacking any current momentum to push prices up and thus moving sideways but still in an uptrend. You can have a trend without momentum, and have momentum without a trend.
Stock Investing Strategies
Investing in stocks can take many forms, from value investing to event-driven trading to long/short strategies. Different trading strategies can be applied to different timeframes.
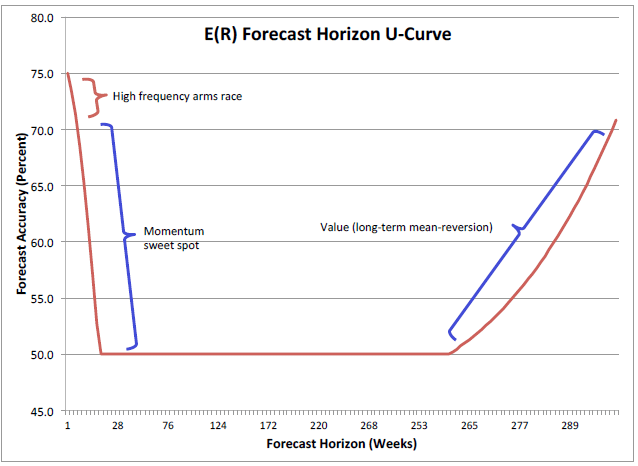
The most common form of investing in stocks is investing with a timeframe of 1-3 months during low volatility periods when it has been historically proven that stocks experience momentum.
Momentum investing is short-term investing, as traders are merely looking to capture part of the price movement in a trend. It involves long and short trading.
Value investing on the other hand, is long-term investing where traders are looking to buy undervalued stocks or assets in general in speculating that stocks will revert to their fair values.
Fundamental Analysis

Equity valuation depends on 2 variables:
- Price / Earnings (P/E)
- Stocks’ Forward earnings
Example: S&P 500 current level of 4,400 = Forward earnings ($200) x P/E Multiple (22)
Price-to-earnings ratio (P/E): The price-to-earnings is the price investors are willing to pay for each $1 of earnings.
Forward earnings: Forward earnings are analysts forecasted earnings on a single stock or index
P/E multiples vs Interest Rates: All financial markets compete for investors depending on their expected returns and risk. As a result, the level and dynamics of interest rates affects corporate bond rates which in turn affects the earnings yield investors are willing to accept for taking the stock risk and the final stock valuation.
Expected Equity Yield: (Terminal Forward Price (calculated as Forward Earnings x P/E multiple) minus current price) divided by current price and multiplied by (number of days to full forward earning earnings divided by 365)
Example: P/E Multiples versus Interest Rates
Assume current US corporate yields are at 2.25%. Investors would require buying stocks with an expected equity yield of 4% to compensate for the elevated risk of holding equities which are much riskier than corporate debt which is safer.
If long-term rates rise given stable expected earnings, bond yields will also rise and as a result investors will require a higher equity yield to buy stocks.
This will lead to either lower future valuations if multiples reduced or forward earnings need to be expected to grow to take up that slack to retain current valuations.
Monitoring the yield curve is critical to predict P/E multiple growth. Market corrections are correlated with yield curve steepening which means higher yields.
MacroVar models monitors the S&P 500 current valuation versus the different scenarios of P/E multiples and earnings per share based on interest rate dynamics and forward earnings new releases.

Check in the table above an example of the range of S&P 500 valuations based on different combinations of P/E multiples and earnings per share forecasts.