Interpreting the RSI indicator as a professional trader
RSI indicator definition
The RSI indicator measures the speed and change of price movements. The RSI indicator oscillates between 0 and 100. RSI is a useful indicator during normal trending market conditions when an asset price oscillates around its trend value. During big moves and strong trends however, like short squeezes or price spikes RSI and other oscillators don’t work.
RSI Logic
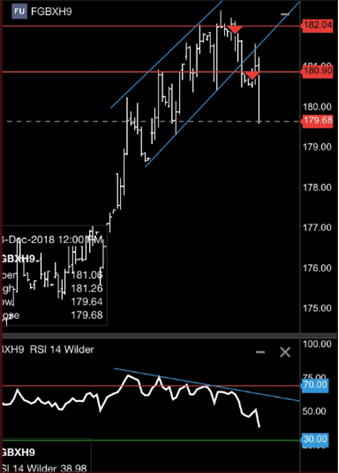
When the RSI indicator reaches values above 70 it is “overbought” and when below 30 it is “oversold”. RSI theory argues that if RSI reverses, momentum weakens and may be bound to reverse. However, an asset can go up quickly and can continue further appreciation but at a slower pace. Hence, “overbought” and “oversold” conditions must be used with caution.
The most important signal to pay attention to is during the second move of the RSI indicator to the danger zone. If the second move fails to confirm the price move into new highs or new lows (forming double top or bottom on the oscillator), then divergence exists. If the oscillator moves in opposite direction to the price action, breaking a previous high or previous low, divergence and swing failure is confirmed.
How to use RSI
During normal trend market conditions and when a security is in downtrend RSI values between 50-60 signify overbought conditions before the downtrend is ready to resume. During uptrend, RSI values of 40 to 50 signify oversold conditions before the uptrend is ready to resume.
It is strongly not recommended to enter a position when the RSI is “overbought” and falling or vice versa.
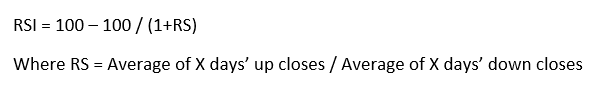
RSI indicator formula