Mastering Technical Analysis: Strategies for Success in Financial Markets
Technical analysis is a set of trading tools used to predict an investment’s trend by analysing the investment’s price movement and volume. These patterns result from a psychological tendency of market participants in making decisions.
Professional traders first analyse the economic fundamentals, global market risk and financial factors affecting a specific investment and then use technical analysis tools to decide whether to execute the trade or wait. Combining economic fundamentals with market risk monitor, factor analysis and technical analysis helps professional traders increase the odds of a successful investment.
Using technical analysis as a primary means for evaluating an investment can be dangerous and misleading.
Technical analysis is used to analyse any financial security including stocks, bonds, commodities, currencies, and futures.
How to use Technical Analysis
MacroVar models use quantitative technical analysis indicators to evaluate financial markets’ trends and momentum. Quantitative indicators are objective and can be back tested whereas qualitative indicators are vaguer. Traditional technical analysis methods include qualitative indicators. Click here for a step by step guide.
Trendline
Technical analysis indicators are used to predict a security’s trend. Hence a short introduction in price trends is required.
There are three price trends that are simultaneously active in any market: the short-term trend which lasts from days to weeks, the medium-term trend which lasts from weeks to months and the long-term trend which lasts from months to years. All three trends are active all the time and may be moving in opposite directions.
Traders focus on the intraday and short-term trend varying from minutes to weeks. Speculators focus on the medium-term trend holding market positions for a period of weeks to months. Investors focus for the long-term trend holding positions from months to years.
The long-term trend is the most important trend and the easiest to identify. It is of primary concern to the investor. The medium-term can move with the long-term trend or against it. If the medium-term trend retraces significantly, it is characterised as a correction. The characteristics of a technical correction must be rigorously evaluated to avoid confusing it with a change in the long-term trend.
An upward market trend is a long-term move with a series of higher highs and higher lows.

A downward market trend is a long-term price movement consisting of a series of lower lows and lower highs.
Market trends are long-term in nature last from weeks to months.
Technical Analysis Quantitative Indicators
MacroVar Market trends model
MacroVar has created the technical analysis indicator Trend signal to monitor a market’s trend. The Trend signal ranges from -100 to +100. MacroVar trend model can be used as a trend strength indicator. MacroVar trend strength values ranging between +75 and +100 or -75 and -100 show strong trend strength. A technical rollover is identified when MacroVar trend strength indicator moves from positive to negative value or vice-versa. Learn more about how the indicator is calculated and how to use the MacroVar Trend Signal.
The most important trend indicator
The 52-week simple moving average and its slope are the most important technical analysis indicators to monitor a market’s trend. An uptrend is characterised by price above the 52-week moving average followed by an upward slope. If fundamentals of the market have not changed and the moving average slope is still in uptrend, a price drop signifies a market correction and not a change of trend. Traders should watch oscillators like MacroVar oscillator and RSI to buy the dip and still follow the trend. The moving average slope turn signifies a change of trend.
Momentum Indicator
Momentum trading is used to capture moves in shorter timeframes than trends. Momentum is the relative change occurring in markets. Relative change is different to a trend. A long-term trend can be up but the short-term momentum of a specific market can be 0.
If a market moves down and then moves up and then moves back down the net relative change in price is 0. That means momentum is 0.
A short-term positive momentum, with a long-term downtrend results in markets with no momentum.
MacroVar Momentum model
MacroVar Momentum indicator ranges from -100 to +100. The market trend signal is derived as the mean value from 4 calculations for each asset. A technical rollover is identified when MacroVar momentum strength indicator moves from positive to negative value or vice-versa. Learn more about how the indicator is calculated and how to use MacroVar Momentum model
Overbought Indicator
A security is overbought when it is subject to a persistent upward pressure due to extreme fund inflows. When a security is overbought it is often due for a correction.
MacroVar monitors all major financial markets for technically overbought conditions. Values of the MacroVar momentum oscillator higher than +2.5 signify overbought conditions. Learn more about the MacroVar overbought indicator.
Oversold Indicator
A security is oversold when it is subject to a persistent downward pressure due to extreme fund outflows. When a security is oversold it is often due for a rebound.
MacroVar monitors all major financial markets for oversold conditions. Values of the MacroVar momentum oscillator lower than –2.5 signify overbought conditions. Learn more about the MacroVar oversold indicator.
Relative Strength Index
The Relative Strength Index (RSI) measures the speed and change of price movements. The RSI indicator oscillates between 0 and 100. RSI is a useful indicator during normal trending market conditions when an asset price oscillates around its trend value. During big moves and strong trends however, like short squeezes or price spikes RSI and other oscillators don’t work.
The most important signal to pay attention to is during the second move of the RSI indicator to the danger zone. If the second move fails to confirm the price move into new highs or new lows (forming double top or bottom on the oscillator), then divergence exists. If the oscillator moves in opposite direction to the price action, breaking a previous high or previous low, divergence and swing failure is confirmed.
Learn more about how to use Relative Strength Index.
Simple Moving Average
A Simple Moving Average (SMA) is the average price of a security over a given number of days. Simple Moving Average is a common momentum indicator used in technical analysis to monitor whether a security’s momentum is rising, falling or is bound to reverse.
The important timeframes to monitor the simple moving average are: 20 days, 60 days, 120 days and 250 days. Simple moving averages are used to calculate the MacroVar Market trends indicator which ranges between -100 and +100.
Timeframes
Technical analysis indicators depend on the timeframe under examination. During normal market conditions occurring 80% of the time historically, the typical trading timeframe used ranges between weeks to months. Hence, traders should use daily charts and monitor a timeframe of one to three months to find trading ideas.
During high volatile market conditions which occur approximately 20% of the time, the trading timeframe must be reduced from 1 day to 1 week. Technical analysis tools use 60 minutes and 240 minutes charts to time the extremely volatile conditions right.
Price action
Price action trading is the close examination of actual price movements to make trading decisions. Price action is used to determine the trend of a market. A strong trend is proven consistent positive or negative returns on week to week basis during normal market risk conditions where volatility is low.
MacroVar Trading Models Logic
Financial Markets and Macroeconomic conditions are interlinked. When an asset’s fundamentals are healthy (for example a country’s stock market index main fundamental indicator is the country’s manufacturing PMI), the related financial market will also follow.
However, sometimes macroeconomic indicators may show weakness, and because central banks and policy makers react, market price action takes over and sentiment changes causing breadth shift and risk off turns to risk on.
During economic recessions after financial markets become really oversold, they may rebound strongly but that would be short term. Business confidence, consumer confidence and inflation outlook which are the main fundamental factors of the economy don’t’ change quickly.
Hence, when fundamentals of a specific market are healthy and remaining unchanged, and at the same time the market is in a strong uptrend, a reversal of the market is just a technical correction towards an upsloping trend. Prudent portfolio managers are using oversold indicators like the MacroVar Oversold indicator and RSI to time the market and buy the dip. When moving averages slope turns down, it signifies a change of trend and traders should follow the change of trend.
When fundamentals of a specific market are weak and the long-term trend is down calculated by moving averages slopes, prudent portfolio managers use overbought oscillators like the MacroVar overbought indicator and RSI to short the counter trend rally.
A change of trend occurs when moving averages slopes roll over. MacroVar market trend indicator and MacroVar momentum indicator monitor major moving averages values and slopes as well as returns. An MacroVar market trend indicator reversing from values greater than 0 to lower than 0 indicator a change of trend.
Prudent portfolio managers should invest in markets which have got good momentum and good trends. Trying to pick a change of trend is a false strategy leading to losses.
There is an old saying: Market goes up with the escalator and down with the elevator. During a downtrend, an upturn which is sharp and not gradual (not an escalator) signifies a technical rebound and not a new bull market trend.
Sell complacency, buy fear. In other words, traders should buy umbrellas in sunshine and sunscreen in rain when it’s cheap.
When a trade is obvious, is obviously wrong.
Picking tops and bottoms is not a strategy
Be patient and wait for the trade. Do not chase the market. Trading is a marathon, not a sprint.
Technical Analysis Qualitative Indicators
Trendline
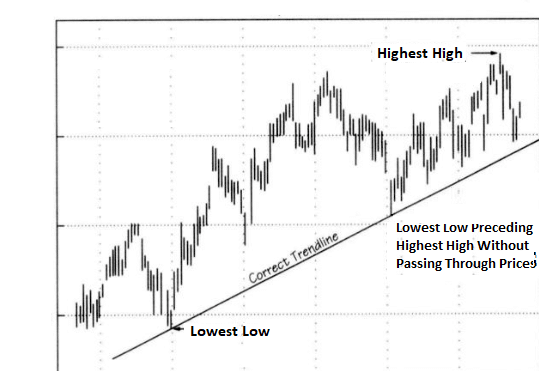
The most important tool in technical analysis is determining a security’s trend. A trend is the prevailing direction of price movements within a given period. In an upward trend, prices rise consistently interrupted by temporary sell offs. In a downward trend prices move consistently downwards interrupted by temporary rallies.
To draw a trendline follow these steps:
- Select the time period under examination: Portfolio management timeframe of weeks to months (1-3-month timeframe) or short-term trading timeframe of days to weeks (2 week timeframe).
- For an uptrend, draw a line from the lowest low to the higher minor low preceding the highest high so that the line does not cross through prices between the two low points
- For a downtrend, draw a line from the highest high point to lowest minor high preceding the lowest low so that the line does not cross through prices between the two high points.

Change of Trend
The ideal way to trade markets is to buy at the bottom and sell at the top. However, this is impossible to achieve. But using the following technical analysis can help you catch 60 to 70% of a security’s move.
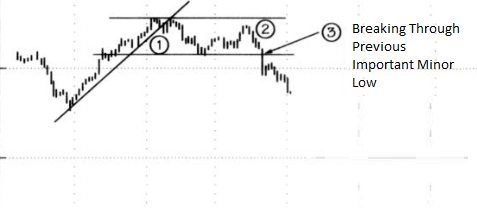
The following technical analysis technique is used to identify a change of trend:
- A trendline is broken when prices cross the trendline
- The trend stops making higher highs in an uptrend or lower lows in a downtrend. In an uptrend after a minor sell-off, prices will rise but fail to carry above the previous high. This occurs when a trend is in the process of changing.
- Prices go below a previous short-term sell-off low in an uptrend

Support and Resistance
The trading levels of support and resistance are important indicators in technical analysis. Technical support occurs during a downtrend when the trend reverses due to increase demand. Technical resistance occurs during an uptrend when the trend reverses due to increased supply. For securities trading in a range, a potential strategy would be to buy the dip and sell the highs.

Head and Shoulders
The trading pattern of head and shoulders is an important indicator in technical analysis. A head and shoulders formation indicates a market top, a reversal of trend and the beginning of bear trend. Head and shoulders patterns are reliable patterns, and their successful completion gives an excellent indication of a trend reversal.

Reverse Head and Shoulders
The reverse head and shoulders pattern is equal and opposite to the head and shoulders pattern.
Double Tops and Bottoms
A double top consists of two peaks separated by a reaction. Its main characteristic is that the second top is formed with less volume than the first
Flags
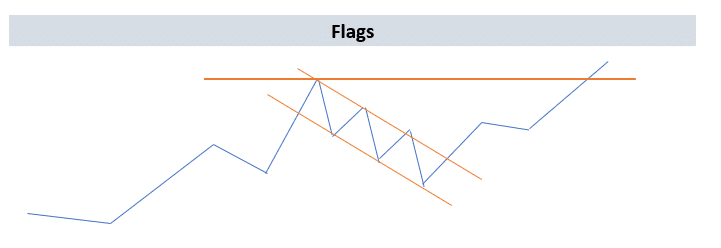
A flag represents a pause accompanied by a trend of declining volume that interrupts a sharp, rise or decline. When the flag is completed, prices break out in the same direction that they were moving prior to its formation. Flags can form in a period ranging from 5 days to 3 weeks. They represent a period of controlled profit taking in a rising market.

Pennants
A pennant is like the flag. It represents a consolidation formation which can be constructed with two converging trendlines.

Trading Volume
Trading volume is one of the most important technical analysis indicators. It must be examined in conjunction with a security’s price movements.
High levels of trading volume indicate a significant price move. A consolidated breakout followed by high trading volume confirms the move. Trades with lower than average volume should be avoided.
Learn how to use trading volume in your trading.
Technical Analysis in Portfolio Management
As already explained, technical analysis should be used as a supplementary final tool before making an investment. Professional portfolio management involves generating investment ideas by firstly analyzing economic fundamentals, global market risk and financial factors affecting a specific investment and then using technical analysis tools to decide whether to execute the trade or wait.
Use our step by step guide on portfolio management to explore how to invest like a professional fund manager.
Breakout trading
Breakout trading is buying a specific financial security with the anticipation of a rising trend after a period of price consolidation and narrow trading range. Learn more about breakout trading.
MACD
The MACD is a trend deviation indicator using two moving averages. MACD is interpreted by using the signal-line crossovers as buy and sell signals.
The MACD is composed using two moving averages. The shorter moving average is subtracted from the longer moving average. The two moving averages are calculated on an exponential basis, where more recent periods are move heavily weighted than in a simple moving average.
The MACD is then smoothed with a third exponential moving average (EMA), which is plotted separately. This average is the signal line, and the crossovers generate buy and sell signals.
MacroVar uses the 21-day moving average as the short-term moving average, the 34-day moving average as the long-term moving average and the 55-day moving average as the signal line. MACD is interpreted by using the signal-line crossovers as buy and sell alerts.
Learn how to use the MACD in investing.
Sign up free using the forms on the right to explore trading ideas using the MacroVar platform and to download MacroVar trading analysis Excel tools.