Unlocking Financial Opportunities: An In-Depth Introduction to Trading
The goal is to establish a system that enables retail investors to adopt the successful strategies used by professional traders, thereby gaining similar advantages.
The system aims to help retail investors achieve consistent profitability by allowing them to apply the same methods used by successful professional traders within their own retail brokerage accounts.
Understanding the Industry
Many retail traders around the world have a skewed perception of what it means to be a professional trader and what their work entails.
If you’re a novice retail trader, it’s crucial to recognize that you’re entering a highly developed and intricate sector filled with exceptionally smart, ambitious, and cutthroat individuals, as well as teams and organizations.
From the perspective of a professional trader, the notion that a beginner in retail trading can read an inexpensive book on technical analysis and then easily make substantial profits through day trading is, to put it mildly, unrealistic.
The overwhelming majority of retail traders aiming for quick, short-term profits in financial markets, like day traders, end up losing all their money.
What is a Professional Trader?
Before you can even consider following in the footsteps of professional traders, it’s essential to clearly understand what being a professional trader entails and what their daily activities are.
A Professional Trader is someone who trades full-time, either at an Investment Bank or for a Hedge Fund.
The goal of a Retail Trader is to generate profits through trading, using their own funds as capital. The aim isn’t solely to earn money when the market is rising, but to profit irrespective of market trends.
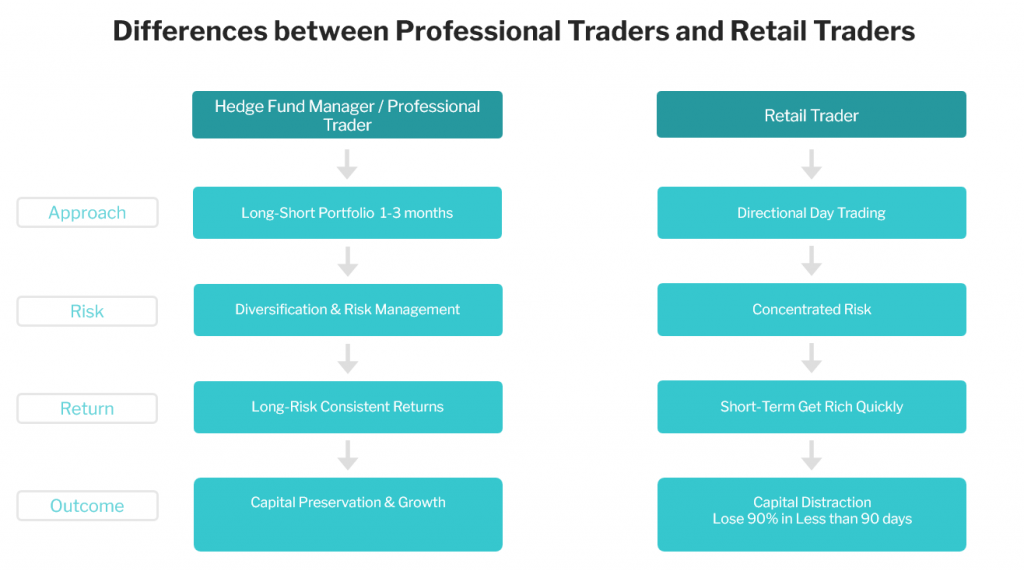
Professional traders maintain diversified portfolios with both long and short positions, typically over a 1-3 month timeframe. Their goal is to generate profits regardless of market direction (absolute return).
Professional traders receive a base salary. Hedge fund managers cover their own and their employees’ salaries through the annual management fee, which is intended to cover the fund’s operational costs for the year.
What sets Professional Traders apart from Retail Traders?
Retail Traders aim to generate profits through trading, using their own funds as capital. Naturally, they often look to the most successful Professional Traders who also use their own capital, hoping to mimic their strategies. However, the challenge lies in the fact that misinformation and Conflicts of Interest are prevalent in the global Retail Trading sector. As a result, the majority of Retail Traders are not only unaware of these successful strategies but also lack the know-how to apply them
Expectations Management — Professional traders focus on long-term wealth accumulation and understand the importance of managing expectations. They implement strategies to ensure that even if things don’t go as planned, they remain in the trading game.
Focus on Compounding — Professionals aim for stable, risk-adjusted returns that compound over an extended period. This approach not only facilitates wealth generation but also attracts external investors, thereby amplifying their wealth-creating potential.
Trading used for Asset long-term growth, Not Income — Professionals recognize that trading is not a source of regular income. Instead, they view their trading account as an asset that should be nurtured and grown over time.
Separate Income Stream — Professional traders maintain a distinct source of income to cover living expenses. Unlike retail traders, who often view trading as a means of income, professionals never withdraw from their trading accounts, prioritizing long-term growth and wealth accumulation.
How Can Retail Traders Achieve Long-Term, Consistent Profitability?
Stage 1: Let Go of Outdated Beliefs: First acknowledge that your previous notions are ineffective. While you might have had sporadic wins, your long-term performance is likely to be negative. This is because you haven’t adopted a sustainable, professional approach to trading.
Stage 2: Master the Professional Trading Methodology: To achieve long-term success, you need a systematic approach that yields consistent returns. Start by understanding the principles behind how professional traders identify trading opportunities, time their entries and exits, structure their trades, manage portfolios, and both proactively and reactively handle risk.
Stage 3: Execute with Real Money: Once you’ve learned the necessary techniques, it’s time to apply them in a real-world trading environment using actual funds. Practicing on demo accounts won’t suffice. Aim for consistent, positive returns over multiple trades and an extended timeframe. If you struggle to translate theory into practice, consider seeking guidance from a professional mentor. Ensure that your weekly commitment in terms of hours and quality of work is both sustainable and repeatable.
Stage 4: Achieve Autopilot Efficiency: At this stage, managing your trading account and weekly routines becomes second nature. You’re capable of generating high-quality trading ideas regularly, effectively managing your portfolio, and adeptly handling both successes and setbacks. You’ve reached a professional level of competence while operating as a retail trader.
Why Retail traders fail?
90% of retail traders lose 90% of their capital in less than 90 days.
The goal of the Retail Trader is to generate profits through trading, using their own funds as investment capital. The aim isn’t solely to profit when the market is on the rise, but to earn money irrespective of market trends.
Nonetheless, a large proportion of Retail Traders end up losing money. Various factors contribute to this outcome.
Your broker is your enemy
Retail brokers have the following revenue sources when you trade. Their aim is to maximize these revenues fast as you incur losses. Brokers try to maximize the following sources at your expense:
Retail Brokers Revenue Sources: (Spread + Commission) + (Financing Margin + OTC Profits) + (Data Sales)
Spread: Profit generated by setting a wider spread than the actual underlying asset and incentivizing you to trade more often and with a large size
Commission: Profit earned by adding a percentage-based commission to the spread
Order Flow Sales: Profit generated by selling client order flow to hedge funds on a per-trade basis, in order for hedge funds to profit by taking the other side of retail traders
Financing Margin: Profit made from the percentage difference between borrowing rates from creditors (like banks or investors) to support leveraged trading and the rates charged to clients.
OTC Gain: Profit made by taking the other side of losing clients
Example of Financing Margin: A broker secures a credit line from an investment bank, allowing them to borrow up to $250 million at an annual interest rate of 1.0%. The broker then offers this credit as leverage to retail traders at an annualized rate of 2.2%.
OTC Profits: Profit earned by taking the opposite position of losing client trades
While the revenue from Spread and Commission is generally well-known, many people are unaware of the Broker’s Over The Counter (OTC) and Financing Margin revenue streams, as well as their data sales business.
If Spread and Commission were the only sources of revenue, the Broker would earn more money as clients trade more frequently and in larger volumes.
The new Business model: Commission free trading
Commission free trading platforms use “trade for free” marketing slogan to get retail traders on the platform and to get them addicted to day trading and earn profits using two methods in the process.
Data Sales: Profit generated by selling client order flow to hedge funds on a per-trade basis, in order for hedge funds to profit by taking the other side of retail traders
Financing Margin: Profit made from the percentage difference between borrowing rates from creditors (like banks or investors) to support leveraged trading and the rates charged to clients.
The abuse of Margin
Brokers want to persuade to use margin (leverage) to maximize your returns. In reality, they want you to use leverage in order to maximize their profits of financing you.
Let’s move to some definitions in trading platform.
Initial margin and maintenance margin are designed to protect you against adverse market conditions, by creating a buffer between your trading capacity and margin close-out level.
Initial margin: a pre-trade margin check on order placement, i.e. on opening a new position there must be sufficient margin collateral available on your account to meet the initial margin requirement for the entire margin portfolio.
Maintenance margin: a continuous margin check, i.e. the minimum amount of cash or approved margin collateral that must be maintained on your account to hold an open position(s). Maintenance margin is used to calculate the margin utilisation, and a close-out will occur as soon as you do not meet the maintenance margin requirement.
How will the initial margin prevent trading up to 100% margin utilisation?
When you place a new order, existing open positions and orders are included in the calculation of the initial margin requirement.
Initial margin requirement = New order initial margin + Sum (initial margin orders) + Sum (initial margin portfolio)
Trading example
You deposit USD 10,000 in your account. You decide to buy 100,000 USDJPY. You hold no other open position(s).
| Trade (USDJPY) | Aggregate Position | Initial margin requirement (USD) | Initial margin available (USD) |
| Buy 100,000 | 2,000 | 8,000 (10,000 – 2,000) | |
| Buy 100,000 | 200,000 | 4,000 (2,000 + 2,000) | 6,000 (8,000 – 2,000) |
| Buy 100,000 | 300,000 | 6,000 (4,000 + 2,000) | 4,000 (6,000 – 2,000) |
| Buy 100,000 | 400,000 | 8,000 (6,000 + 2,000) | 2,000 (4,000 – 2,000) |
| Buy 100,000 | 500,000 | 10,000 (6,000 + 2,000) | 0 (2,000 – 2,000) |
Any further attempt to buy will be rejected since the initial margin available has been utilised.
How is maintenance margin utilisation calculated?
Maintenance margin utilisation is the percentage of margin collateral utilised for trading leveraged products. It is calculated as follows:
Maintenance margin utilisation = (100 x Maintenance margin reserved) / (Account value + Other collateral – Not available as margin collateral)
What is the 100% margin close-out level?
Automatic margin close-out will occur at 100% (maintenance) margin utilisation.
For example:
You deposit EUR 10,000 in your account. You decide to buy 100,000 EURUSD. You hold no other open position(s).
Initial margin requirement = 100,000 x 1.50% = EUR 1,500
Maintenance margin requirement = 100,000 x 1.00% = EUR 1,000
Margin utilisation (at the time of the trade) = 10.0% (EUR 1,000/EUR 10,000)
Later due to market movements there is an unrealised loss on your account of EUR 9,000.
Margin utilisation = 100.0% (EUR 1,000/ (EUR 10,000 – EUR 9,000))
As a result, your margin is fully utilised and therefore you have no capacity to enter into further transactions (except to close out your open position(s)). You will be in breach of margin requirements and, to comply with the margin close-out rule, we shall seek to immediately terminate, cancel and close-out all or part of any outstanding position(s), as well as cancel any open orders.
Comparing Alpha and Absolute Return
Beta represents the market’s overall return, while Alpha is the extra return earned by an investor’s portfolio over the market return.
For example, if the market gains 15% in one year and your portfolio gains 25%, your Alpha for that year is a positive 10%. Conversely, if the market rises 15% and your portfolio only gains 5%, your Alpha is a negative 10% for that year.
Similarly, if the market declines by 15% in a year and your portfolio decreases by only 5%, your Alpha is a positive 10%. However, if the market drops 15% and your portfolio falls 25%, your Alpha for that year is a negative 10%.
Portfolio Volatility and Return
Balancing Investment Portfolio Risk and Return
The ultimate goal for any investor is to achieve a return that outperforms the level of risk taken across various market conditions.
While the ideal scenario would be to earn consistent profits in the financial markets without any risk, this is simply not feasible. In the real world, risk is an inherent part of the equation; it’s what creates market volatility, which in turn provides investment opportunities.
Consider Two Traders:
Trader 1: This trader’s portfolio has an annualized standard deviation of 40%, based on historical data from all held assets. By the end of the year, the trader realizes a 30% return.
Trader 2: This trader’s portfolio has a lower annualized standard deviation of 10%, also based on historical data from all held assets. This trader ends the year with a 18% return.
Who is the better trader?
What truly matters is not just your total return, but your risk-adjusted return.
The Sharpe Ratio quantifies the return an investor or trader gains relative to the risk they assume in their investment portfolio.
Trader 2 has achieved nearly the same return as Trader 1 but with significantly less risk, as indicated by the lower standard deviation. This suggests that Trader 2 is more efficient at managing risk while still capturing a high return, making them the better trader in this scenario.
The Simplified Sharpe Ratio is calculated as the Annualized Return divided by the Annualized Standard Deviation of the Portfolio. For Trader 1, the Sharpe Ratio is 0.75 (30/40), while for Trader 2, it’s 1.8 (18/10).
Average retail traders who are profitable usually have a Sharpe Ratio between 0.1 and 1. This indicates that although they are making money, they are taking on a higher level of risk to achieve those returns, making them less efficient. Exceptional traders typically have a Sharpe Ratio above 1. Those at a professional level often have Sharpe Ratios exceeding 1.5, with a maximum range of around 2 to 2.2 over an extended period.
Investment Strategies Types
This is a brief summary of different types of investments strategies used by hedge funds.
- Long Short Equity Investment Strategies
- Long Short Value This strategy requires investing in equities the portfolio manager believes are cheap/undervalued by the market. Typically they look for equities having discounted valuation multiples or generate high free cash flow.
- Long Short Growth This investment strategy focuses on investing in companies based on growth prospects. Fund managers look at companies’ earnings growth and capital appreciation.
- Sector Focused / Niche These strategies focus on investing in specific sectors (healthcare, tech, energy and materials), geographies, or companies of certain market cpaitalization (small, medium, large cap).
- Short Funds These strategies focus on identifying companies that are overvalued based on various investment criteria including expectations, bad management, fraud etc
- Multi Strategy Long Short Equity These funds use a mix of the investment strategies described above.
- Event Driven Investment Strategies
- Activist These funds invest in the company’s equity capital to obtain board representation in order to influence specific decisions in the company’s management like asset changes, divestitures, buybacks, board modification.
- Special Situations These funds focus on investing in the equity of companies involved in some type of situation like sale, issuance or spin-off.
- Distressed These funds focus on trading corporate credit at a discount due to bankruptcy. They involve negotiations with management and creditor committees to negotiate the outcome.
- Merger Arbitrage These funds invest in equity companies undergoing some type of corporate transaction typically a merger or acquisition.
- Multi Strategy Event driven funds These funds use a mix of investment strategies described above.
- Macro Investment Strategies
- Active Trading These strategies include both systematic and discretionary approaches to investing and positioning is based on macro analysis. These strategies require rapid response to market conditions.
- Commodity trading These strategies use a mix of market data, systematic and/or technical analysis. They focus on investing in commodities like metals, agriculture, energy or some mix of these.
- Currency trading These strategies use a mix of approaches like systematic (algorithmic) or discretionary. They use a top down macro analysis and also identify trends and momentum across the asset classes monitored.
- Thematic trading These strategies use algorithms to determine a position’s size based on certain risk constraints or a discretinary approach where the management team decides portfolio positions based on top down approach.or discretionary apporach
- Multi strategy macro investing These strategies use a mix of investment strategies described above
- Relative value investment strategies
- Market Neutral Equities This strategy requires maintaining a net equity exposure from 0-10%. It also includes factor based trading strategies and statistical arbitrage. Manaers use quantitative techniques to evaluate which positions to buy and sell.
- Fixed Income Relative Value These strategies focus capturing a spread differential. They invest in different asset classes including corporate credit, sovereight debt, convertible arbitrage.
- Convertible arbitrage This investment strategy is a subset of fixed income relative value and seeks to profit from the spread between convertible and non-convertible securities of a specific issuer.
- Volatility This strategy involves investing in volatility instruments of various asset classes
- Risk Parity Investment strategies These funds are focused on risk allocation across different asset classes to manage a diversified investment portfolio based on desired level of portfolio volatility. MacroVar offers a free guide to manage your investment portfolio based on risk parity for free.
- Fund of Funds These funds invest in various other funds with uncorrelated strategies.
- Crypto and/or blockchain investing These strategies involve investing in crypto directly or by investing in crypto infrastructure plays like storage, new platforms and decentralized computing.
Timeframes
An investment strategy has a timeframe on which it operates and exploits market anomalies to capture profits. Timeframes can range from milliseconds to years.
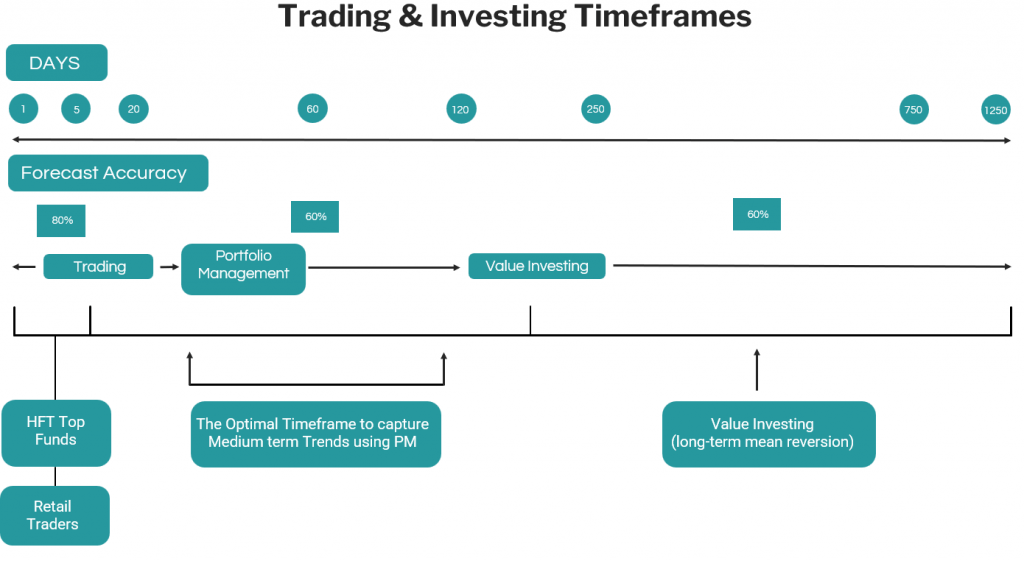
High-Frequency Trading Strategies operate in a short-term horizon ranging from intraday (microseconds) to several days. They exploit structural effects in the marketplace, statistical relationships between financial instruments or information flow. They use big leverage which can often be very risky, and their success is dependent on market microstructure inefficiencies which decay fast over time removing opportunities for profit.
Mean Reversion strategies operate in the short to medium-term horizons and they exploit the mean reverting behaviour of some financial instruments under special conditions. The theory suggests that prices move back towards the mean or average. Statistical stationarity and cointegration are key principles to determine the mean reversion likelihood of prices of financial instruments.
Momentum Investing Strategies operate in the medium-term horizon ranging from weeks to several months and they exploit the momentum structural anomaly. Momentum is caused by human behaviour who usually choose to follow the crowd rather than act against it. As a result, investments keep moving in the same direction for several weeks as rising prices attract buyers while falling prices attract sellers. Academic research has shown momentum to be a valid strategy from the early 1800s up to the present and across nearly all asset classes.
Value Investing Strategies look for stocks with strong fundamentals including earnings, dividends, book value and cash flow selling at bargain prices relative to their true value (quality). The value investor seeks to find stocks of undervalued companies having the potential to increase when the market recognizes the stock’s true value. The big drawback of value investing strategies is their long-term horizon and their inconsistency of returns, which leads most value strategies to generate low sharpe-ratios (less than 1), big maximum drawdowns and high risk.
Proving Day trading fails
To assess the probability of gaining a return from any asset whether it’s real estate, stocks or currencies we must examine the asset’s historical distribution of returns.
When we look at the S&P500 Daily Opportunities in terms of daily returns by calculating the open to close historical returns, the probability of making money is 0. It’s like playing a casino roulette.
The open to close returns distribution shows the following conclusions:
- 52% of the time daily returns are positive while 48% are negative, hence it’s impossible to predict the daily return (50-50 probability)
- If we probability adjust +ve and -ve returns to frequency %, the expected return is nearly 0 (0.34%, -0.31%)
Hence the expected return when day trading is zero. In order to find trading opportunities, timeframe must be broadened as displayed previously to capture trends in 20-60 day timeframe.
Tradable Assets
To identify trading opportunities, distribution of returns is calculated for major asset classes monitored by Macrovar for different time horizons.
The conclusion based on the data above are the following:
- The ideal timeframes to identify trades across assets is the 20-60 day time horizons for stocks, bonds, commodities and currencies.
- Higher expected returns with higher risk are expected when trading mid cap and large cap single stocks.
Remember one thing: The market dictates the opportunities and returns that are available not the trader. The trader must adjust his strategy on this fact.
Summary
Active Portfolio management is the science of structuring a portfolio of investments to protect the capital of clients (investors) and generate steady returns in both rising and falling markets.
The performance of a portfolio management strategy is measured by its Sharpe ratio which summarises in one number the investment return generated compared to the risk undertaken.
Successful portfolio managers generate sharpe ratios between 1.0 and 3.0 in all market environments including economic recessions and bear markets.
The aim of portfolio managers is to generate consistent adjusted returns with high sharpe ratios, compounded over many years to generate growth and wealth creation.
Ray Dalio Investment Principles
One of the most successful investors is Ray Dalio, founder of the world’s largest hedge fund ($150bln AUM). The most important principles in investing are:
- The holy grail of investing is finding 15 or more good uncorrelated return streams
- Diversification can reduce risk more than it reduces returns so it improves return-to risk ratio
- Return streams can be risk adjusted to be risk balanced
- Systematic decision making; rules should be timeless and universal
MacroVar was designed to provide you with the models and portfolio management tools to manage your portfolio with these principles in mind. Sign Up free.
Evaluating Portfolio Management Strategies
To examine a portfolio management strategy, you need to analyse the following metrics for a historical period including bear markets, bull markets and different economic environments:
- Average Annual returns: Average annual return (AAR) is the percentage historical return of an investment portfolio.
- Volatility: Volatility describes the degree to which an investment portfolio’s value moves up and down. This is the portfolio’s risk. If an investment portfolio has an average annual return of 10% with a volatility of 15%, investors should expect annual returns to fall within a range of 5% (10% minus 15%) to 25% (10% plus 15%).
- Sharpe Ratio: Sharpe ratio helps investor understand the return of an investment portfolio compared to its risk. Successful portfolio management strategies generate the highest return possible with the lowest volatility. Successful portfolio managers generate sharpe ratios between 1.0 and 3.0.
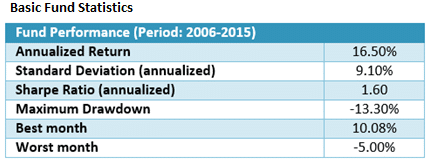
- Maximum Drawdown: An portfolio management strategy suffers a drawdown when it loses money. Maximum drawdown measures the largest single drop from peak to bottom in the portfolio’s value. Investors in a fund with a max drawdown of 50% saw their portfolios lose half of their value. Investors should select portfolio managers which have historically generate good returns with the lowest possible maximum drawdown. Portfolios with Maximum Drawdown between 5% and 20% are considered professionally managed portfolios.
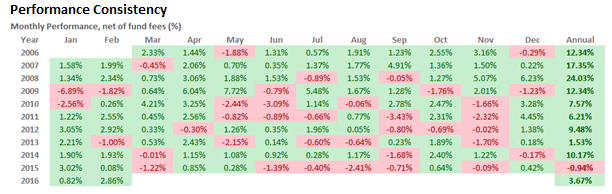
- Performance Consistency: A portfolio manager’s performance should be examined for long historical periods of at least 10 years to confirm how an portfolio performed during different market environments (Growth, Recession, bull and bear markets).
Market crashes:Special attention must be given on how an investment portfolio performed during market crisis like 2000 dot-com bubble, 2008-2009 crash etc.
Longer periods of historical performance often guarantee similar future portfolio performance irrespective of the market environment.
Comparing Portfolio Management strategies
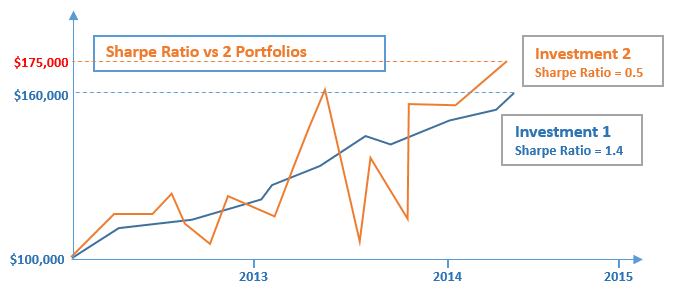
Before selecting a portfolio manager, you should compare his portfolio’s historical performance with benchmarks like the US stock market index (S&P 500). However, the correct metric to compare the performance of a portfolio manager with a benchmark is not the annual return generated but the sharpe ratio generated. You need to compare the return generated per unit of the volatility experienced. To make thigs clearer check below the comparison of 2 investment portfolios.

Assume you had to choose between two portfolio managers with the portfolio’s performances displayed above. Although portfolio manager two has a higher ending value than portfolio manager one, his portfolio experienced a much higher volatility and drawdown than portfolio manager one. Most probably, portfolio manager one structure a more diversified, balanced investment portfolio which was able to generate smoother returns with lower volatility. The investment portfolio of the manager one outperformed the portfolio of portfolio manager two generating a sharpe ratio three times higher.
In the example above, during the second half of 2013, the second portfolio value dropped from $160,000 to $105,000 losing 35% of its value. On the other hand, the first portfolio experienced during the same period a maximum drawdown of just 4.5%.
Active Portfolio Management
A portfolio manager also known as a professional trader is a full-time trader working at an Investment Bank or Hedge fund.
The aim of portfolio managers managing a typical portfolio involves structuring a long / short diversified portfolio of 10 to 20 uncorrelated investment positions.
Professional active portfolio managers in hedge funds, investment banks and other investment firms follow a specific approach to manage their portfolios.
MacroVar Framework
The MacroVar framework aims to utilise the best of what works from Macroeconomics. Microeconomics, fundamental analysis, quantitative models and risk management to stack the odds as high as possible to generate consistent returns with low risk in all risk environments.
The MacroVar framework consists of the following stages:
- Global Macroeconomic Conditions: Macroeconomic conditions are monitored daily by analysing leading macroeconomic indicator releases to predict global economic growth 6-12 months ahead.
- Country Macroeconomic & Geopolitical conditions: Macroeconomic conditions and newsflow for a specific country are monitored to predict economic and inflation expectations which affect the country’s stock market, bonds and currencies.
- Sector/Industry Analysis: Financial reports and research are used in a bottom up approach to identify potential investing opportunities across all sectors and industries globally.
- Financial Markets Overview:MacroVar Quantitative Models and Factor Models are used to monitor financial assets price dynamics and the macroeconomic and financial factors affecting them. The Financial markets monitored are:
- Risk Management: Current Global financial risk and volatility models are used to in combination with asset’s volatility & rolling correlation parameters to adjust the portfolio’s overall net exposure and individual positions.
- Portfolio Management: Based on real-time analysis of Global Macroeconomic, geopolitical newsflow, quantitative models, factor models and risk managmeent models, the portfolio’s structure is continuously monitored and updated on the following levels: gross exposure, net exposure, beta hedging, position sizing.
Next actions
The first section we will analyse is top down approach.
If however you are interested in passive portfolio management strategies generating consistent returns with low risk and minimal effort check investment strategies.