EURIBOR forward curve Research & Data
MacroVar analyses the EURIBOR forward curve to monitor the market's expectations for the ECB's monetary policy actions (rate hikes/cuts) and its effects on financial markets and the Eurozone economic outlook. Explore how to interpret the EURIBOR forward curve dynamics.
EURIBOR forward curve
Euribor forward curve presents the 1-month and 3-month EURIBOR forward curves. They indicate the market's anticipated future fixings. These forward curves are commonly used for forecasting and underwriting floating-rate debt.EURIBOR forward curve dynamics
Euribor forward curve dynamics presents how the 3-month EURIBOR forward curve shape changed in the last month. The latest Euribor forward curve is compared to the Euribor forward curve 1 week ago and 1 month ago respectively.What is the EURIBOR forward curve
The EURIBOR forward curve is a graphical representation of the market clearing forward rates for EURIBOR. EURIBOR forward curve is derived from data of EURIBOR swap rates. These forward curves are used to price EURIBOR-based derivatives.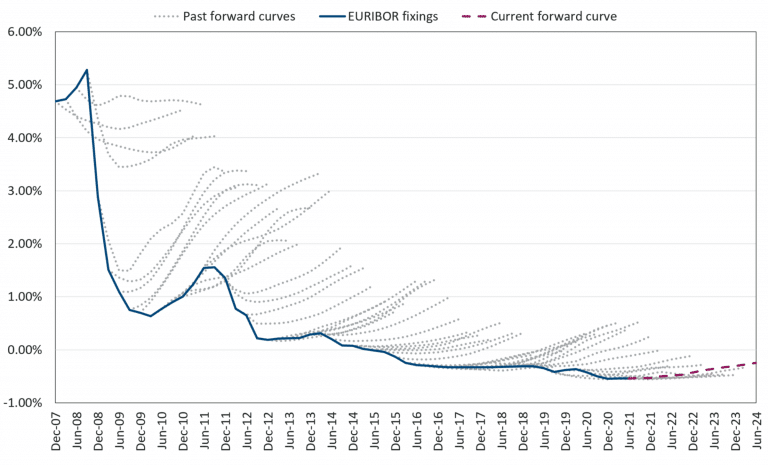
The EURIBOR forward curve represents the market's expectation of future interest rates. It represents the market's net position between fixing and floating for various terms.
Interpreting the Euribor Forward Curve dynamics
When the European economy is strong and inflation expectations are rising the market is expecting central banks to raise rates in order to decelerate economic and inflation expectations. Short-term interest rates like the Euribor 3-month interest rate and the EONIA interest rate are linked to the macroeconomic environment, fiscal and monetary policies and the financial markets (commodities).Hence, short term interest rates should be expected to rise and their related futures which are the 3-month LIBOR futures and 1-month EONIA futures should sell off (note: implied interest rate for futures is calculated as 100 minus the futures price). At the same time and since markets are interrelated, fixed income markets are linked the Yield Curve (10-year minus 3-month). The Yield curve steepens when growth expectations are rising and flattens when growth falls (MacroVar monitors all macroeconomic and financial factors which are leading indicators of growth expectations).
When central banks set rates correctly, we should expect smooth slope implied curve in the short term interest rate futures markets.
Highly sloping implied rate curves imply that the central bank reacted too late, the economy has overheated causing inflationary pressures and the futures markets imply aggressive interest rate hikes.
An Inverted implied rate curve implies that the central bank reacted too late, hence has to be more aggressive in order to combat inflation pressures, causing the business cycle to shorten, a possible recession due to early fast hikes and interest rate cuts later on to combat an impeding recession.
European Central banks's (ECB) meetings affect these markets to a large extent. When the ECB becomes more hawkish (tendency to raise rates) or dovish by either adjusting interest rates and/or use QE/QT, it affects the Short-term interest rates futures markets directly.
When the German 2-year bond yield which is determined by market forces falls below the ECB refinancing rate it implies the market expects ECB to cut interest rates in the short-term future in order to boost the economy which is currently weak.