Portfolio Investment Strategies to maximize and protect your wealth
MacroVar executes portfolio investment strategies suited to passive investors willing to protect their portfolios and achieve steady growth.
Investment Portfolio aims
There is a great variety of options to invest your capital like selecting a financial advisor to run your portfolio for you or select passive instruments like ETFs and mutual funds. Before even considering to start investing check our free investing guide on how to select an appropriate investment based on your financial risk profile.Click on each strategy from the investment strategy database below to explore in depth analysis for each strategy.
If instead you are interested in active trading sign up to access MacroVar research and free consulting.
| Strategy | Type | Annual Return | retrng | Volatility | volrng | Sharpe Ratio | shrng | Max Drawdown | maxddrng |
|---|---|---|---|---|---|---|---|---|---|
| Hybrid Asset Allocation | Tactical Asset Allocation | 15.9% | 5-10% | 9.1% | 10-15% | 1.26 | 0-0.5 | -10% (10/1975) | 20-30% |
| Bold Asset Allocation | Tactical Asset Allocation | 14% | 5-10% | 8.4% | 10-15% | 1.12 | 0-0.5 | -10.5% (02/2023) | 20-30% |
| Vigilant Asset Allocation | Tactical Asset Allocation | 11.6% | 5-10% | 7.6% | 10-15% | 0.94 | 0-0.5 | -10.5% (02/2023) | 20-30% |
| Financial advisor strategy | Tactical Asset Allocation | 11.6% | 5-10% | 7.6% | 10-15% | 0.94 | 0-0.5 | -10.5% (02/2023) | 20-30% |
| Dual Momentum | Tactical Asset Allocation | 11.3% | 5-10% | 8.2% | 10-15% | 0.84 | 0-0.5 | -11.1% (07/2022) | 20-30% |
| Adaptive Asset allocation | Tactical Asset Allocation | 10.7% | 5-10% | 9.8% | 10-15% | 0.8 | 0-0.5 | -10.5% (02/2023) | 20-30% |
| Robust Asset Allocation | Tactical Asset Allocation | 9.6% | 5-10% | 6.7% | 10-15% | 0.79 | 0-0.5 | -10.5% (02/2023) | 20-30% |
| Tactical Asset Allocation | Tactical Asset Allocation | 11.4% | 5-10% | 10.3% | 10-15% | 0.7 | 0-0.5 | -10.5% (02/2023) | 20-30% |
| Risk Parity portfolio | Tactical Asset Allocation | 8.4% | 5-10% | 5.6% | 10-15% | 0.68 | 0-0.5 | -10.5% (02/2023) | 20-30% |
| Golden Butterfly Portfolio | Tactical Asset Allocation | 9.4% | 5-10% | 8.5% | 10-15% | 0.57 | 0-0.5 | -17.8% (09/2022) | 20-30% |
| All Weather Investing | Tactical Asset Allocation | 9.0% | 5-10% | 8.1% | 10-15% | 0.55 | 0-0.5 | -21.1% (09/2022) | 20-30% |
| Permanent Portfolio | Tactical Asset Allocation | 8.4% | 5-10% | 7.3% | 10-15% | 0.52 | 0-0.5 | -15.6% (09/2022) | 20-30% |
| 60/40 Benchmark Portfolio | Tactical Asset Allocation | 9.4% | 5-10% | 10.0% | 10-15% | 0.48 | 0-0.5 | -29.5% (02/2009) | 20-30% |
Analyzing a portfolio investment
A portfolio investment which ensures good returns with low risk must fulfill the following objective investment criteria and metrics.
Before investing in a portfolio investment you must examine thoroughly it's performance using the following step by step guide:
Step 1: Examine the portfolio investment's Annual Returns
Average annual return (AAR) is the percentage historical return of an investment. The annualized return must be examined for long historical periods of at least 10 years to confirm how an investment performed during different market environments (Economic Growth, Recessions).
Step 2: Examine the portfolio investment's sharpe Ratio
The sharpe ratio helps you understand the return of an investment strategy compared to its risk. Sharpe ratio is the ratio of the average return earned per unit of volatility experienced. If you want to learn more about examining the investment strategy's risk click here on how to calculate it’s historical volatility.
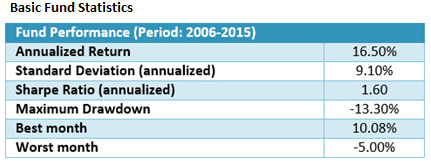
Well performing low risk investment strategies have sharpe ratios between 1.0 and 2.0. In this example, the fund’s Sharpe ratio for the period 2006 – 2014 is 1.60 which is considered excellent.
Step 3. Examine the portfolio investment's Maximum Drawdown
A portfolio investment suffers a drawdown when it loses money. Maximum drawdown measures the largest single drop from peak to bottom in the investment strategy's value. Investors in a mutual fund with a max drawdown of 50% saw their portfolios lose half of their value.
You should ask yourself, realistically, how deep a drawdown will you be able to tolerate and not liquidate your investment strategy? Would it be 20 percent or 10 percent? Comparing your tolerance with the numbers obtained from the investment strategy's historical performance determines whether that investment strategy is for you.
The portfolio investment Maximum Drawdown for the period 2006-2015 is -13.30% which is considered excellent. The strategy during the financial crisis of 2008-09 only lost 13.30% compared to the US Stock Market represented by the S&P 500 which lost 53% (S&P Peaked in October 2007 & bottomed in March 2009)
Investors should select investment strategies with the lowest possible maximum drawdown. investment strategies with Maximum Drawdown between 5% and 20% are considered safe investments.
Step 4: Comparing investment strategies performance
|Before investing in a strategy, you should compare it’s historical performance with benchmarks like the US stock market index (S&P 500), mutual fund indexes and other mutual funds. You should compare the strategy's sharpe ratio and not just it’s annual performance to get an overview of the risk return strategy profile.

Assume you had to choose between two portfolio investments with the investment strategies performance displayed above. Although strategy 2 has a higher ending value than strategy 1, it has a much higher volatility and drawdown than mutual fund 1. As a result, strategy's 1 sharpe ratio is 3 times higher than strategy 2 sharpe ratio and hence for low risk investors strategy 1 is preferred.
In the example above, during the second half of 2013, strategy 2 dropped from $160,000 to $105,000 losing 35% of its value. On the other hand, investment strategy 1 biggest drawdown occurred in end of 2013 losing just 4.5% of its value.
Step 5. Portfolio investment fees
Before investing in a strategy, index or mutual fund you should ask for the fees applied.
Step 5. Gather or request the portfolio investment's historical performance
The first step is to download from the web or request from the strategy the historical monthly returns of the investment strategy for the largest historical period available. You need this information to examine the strategy's performance during bull and bear markets and economic recessions.
You should consider investing only in strategies with historical performance data of more than 10 years including preferably periods of recession and bear markets like the current Covid-19 pandemic crisis and the Global financial crisis of 2008. Special attention must be given to the strategy's performance during economic recessions and bear markets where the probability of losing funds is high.
The investment strategy's net performance must be analyzed after deducting fees.
In the example below, historical monthly returns for the investment strategy span from 2006 to 2015 which is an acceptable historical period to examine.
In this example, the strategy's worst year was in 2008 when the fund lost 2.91% only and the worst monthly return was 5% which is acceptable.
Instead of paying fees to fund managers, you can develop your own investment strategy using our free guide provided below. You can also use our free guide on trading & investing.
Developing your DIY Portfolio Investment
A passive investment strategy allocation is the process of structuring an investment portfolio by allocating funds across asset classes like stocks, bonds, commodities, currencies, real estate and cash.
The guide below explains how to structure a typical investment strategy. The investment strategy analysed is flexible to adapt to different market and economic environments and generate good returns with low risk. To achieve this the strategies were designed based on the following principles:
- Asset Selection of Portfolio: Assets of our portfolios are selected based on their behaviour to all economic and market environments and their dynamic correlations.
- Momentum: Quantitative methods monitor each asset’s momentum and decide whether to keep it in the portfolio.
- Balancing Volatility: Quantitative methods monitor every asset and adjust each asset’s weight on the Investment portfolio.
- Advanced Methods: Quantitative methods optimize each asset’s weight in the portfolio based on volatility, correlation, and minimum variance optimization algorithms.
Balanced Investment Portfolio
The assets selected to structure portfolios is the most important decision an investor should take. Balanced portfolios should use assets uncorrelated to one another in order to generate good returns with low volatility in all market environments.
This asset allocation strategy includes assets which perform well under each of the 4 economic environments the global economy experiences. The assets used to build this portfolio are: US Stocks, US Treasuries Bonds, Emerging Market Stocks, US Real Estate, Commodities and Cash.
Assets are represented by the following high quality Exchange Traded Funds (ETF): 1. VTI (US Stocks), 2. TLT (US Long-Term Bonds), 3. EEM (Emerging Stocks), 4. ICF (US Real Estate), 5. DBC (Commodities) and 6. SHY (Cash)
Financial Assets vs Economic Environment
The global economy status is best described by 2 combined factors: inflation and economic growth.
There are 4 global economic environments:
- Inflationary boom: Accelerating Economic growth with Rising inflation
The best performers are emerging market stocks, international real estate, emerging countries’ currencies, commodities, and TIPS (treasury inflation protected securities).
The worst performers are US treasury bonds and cash since they are adversely affected by rising inflation.
High global growth with rising inflation expectations lifts commodities. Many emerging economies growth is linked to commodities. When commodities rise emerging market stocks, currencies and real estate rise as well.
- Stagflation: Slowing Economic Growth with Rising Inflation
The best asset performers protecting investors from inflation are Gold, Cash, Treasury Inflation Protected Securities, and the US Dollar.
The worst performers are long-duration treasury bonds adversely affected by rising inflation.
- Disinflationary boom: Accelerating Economic growth with Slowing Inflation
The best performers are developed markets stocks, developed Real estate and US Treasury bonds.
Low inflation with moderate growth is a good environment for bonds and stocks and bad for the worst performs which are commodities and commodity related sectors.
- Deflationary Bust: Slowing Economic Growth with Falling Inflation
During this environment the best asset performers are Long-Duration Treasuries and Cash. Everything else experiences big volatility and often large losses.
During crashes and economic depressions bonds rise while stocks and commodities fall. Investors during these environments look for the safety of their asset rushing into the safety of US treasury bonds and the US dollar while selling stocks and commodities.
Stocks versus Bonds
Stocks and Bonds are the 2 main pillars of all investment portfolios. Each of the two assets perform wells during different economic conditions.
When economic growth is high and inflation is rising stocks generate good consistent returns. At the same time, rising inflation is the worst possible economic environment for bonds.
However, when economic growth is slowing and/or inflation is falling or at the extreme cases economic recessions, depressions and market crashes are experienced long-term US bonds is the best performing asset by far, generating good returns with low volatility.
Since the Great depression in 1929, investors in the United States have experienced 24 years of negative stock market returns. During all periods, US Treasury Bonds protected investors from capital loss and served as a flight to safety. In 19 out of 24 years US Treasury bonds generated positive returns.
Momentum
Momentum is one of the largest market inefficiencies generating consistent returns. The fundamental reason is that humans usually choose to follow the crowd rather than act against it. This causes rising prices to attract buyers and falling prices to attract sellers. Academic research has shown momentum to be a market anomaly from the early 1800s up to the present and across nearly all asset classes.
“Cut your losses; let your profits run on” – David Ricardo, 1838
The Simple Momentum Investment Portfolio
There are many quantitative methods to apply momentum to an asset or portfolio. Our simple Momentum portfolio applies momentum as follows:
- Each asset (VTI, IEF, EEM, ICF, DBC) holds an equal weight to the portfolio (20%).
- At the end of every week, the algorithm calculates each asset’s previous 1-month (20 trading days) return
- If the return is negative or zero, we substitute the specific asset with cash (SHY).
- If the return is positive, we keep the asset in the portfolio or we buy the asset if we do not already hold it.
The Simple momentum portfolio generated impressive results while been extremely simple. The portfolio generated three times the risk-adjusted returns of the US Stock market.
The portfolio’s average annual return was 11% when the stock market’s return was 6.4%. A 56% improvement in returns was achieved with half the US Stock market’s volatility. Moreover, the Simple Momentum portfolio lost a maximum of 12.30% during it’s worst performance while the US Stock market lost 59% which is almost 5 times more.
Risk Parity - Balancing Risk
The goal of risk parity is to build an investment portfolio which will generate stable annual returns with lower risk than the same portfolio with equal weight among assets.
Risk parity ensures that each asset in the portfolio contributes an equal amount of risk (volatility) to the portfolio. Each asset’s weight in the balanced portfolio is calculated based on the amount of the asset’s recent volatility as compared to the volatilities of the other portfolio’s assets.
On the other hand, the simple portfolio assigns equal weight to the portfolio’s assetsfocusing on balancing the dollar amounts invested in each asset of the portfolio.
Volatility describes the degree to which an asset’s price moves up and down. Recent volatility of an asset can be estimated by calculating the recent (trailing) 20-day standard deviation of the asset’s returns
During periods of high volatility, asset returns tend to be lower and during low volatility asset returns tend to be higher. When an asset’s volatility spikes it is usually leading to big asset losses.
Balancing Volatility Example
The aim is to build a balanced portfolio with only stocks and bonds and assign equal risk contribution to both assets. The recent volatility of stocks is 2 times (200%) the observed volatility of bonds. The appropriate allocation to each asset would be computed as follows:
Allocation to stocks x volatility of stocks = allocation to bonds x volatility of bonds
Since ratio of volatility of stocks: bonds is 2:1, the allocation would be equal 1:2 that is 1/3 stocks and 2/3 bonds
Structuring the Balanced Portfolio
The Balanced portfolio is structured as follows:
- The Portfolio consists of the following assets: US Stocks (VTI), US Bonds (IEF), Emerging Stocks (EEM), US Real Estate (ICF) and Commodities (DBC)
- At the end of every week the portfolio is structured based on the following calculations:
- Each asset’s recent 1-month (20 trading days) return is computed
- If the return is negative or zero, the specific asset is substituted with cash (SHY) and is allocated 20% of the portfolio’s weight otherwise the asset is kept in the portfolio
- If the return is positive, the asset is held in the portfolio or is bought back if not already included in the portfolio
- Each asset’s recent 1-month (20 trading days) standard deviation is compued. The risk parity formula described above is used to calculate the weights of the portfolio’s assets. The risk parity formula takes into account each individual asset’s volatility versus the volatility of the rest of portfolio’s non-cash assets
- Each asset’s recent 1-month (20 trading days) return is computed
The Risk Parity portfolio generated impressive results while been very simple. The portfolio generated four times the risk-adjusted returns of the US Stock market (Sharpe Ratio of 1.20 versus 0.31 of US Stock Market).
The portfolio’s average annual return was 8.6% when the stock market’s return was 6.4%. Most importantly, the Risk Parity portfolio lost a maximum of 7.2% during its worst performance while the US Stock market lost 59%, 8 times more! This can be viewed clearly from the lower chart above where in blue is the maximum loss of the risk parity portfolio and in orange the maximum loss incurred from the US Stock market.
Risk Parity portfolio has successfully protected its investors while offering consistent returns during the last 10 years.
Portfolio Optimisation
Default risk parity assumes that all assets have a correlation of zero. In reality, assets’ correlations are dynamic and almost never zero. (show charts rolling correlations of assets)
Assets which are highly correlated in the portfolio contribute much more risk than assets that are good diversifiers.
Minimum variance optimization algorithms strive to find the perfect weights of all assets in a portfolio by estimating dynamic volatilities and correlations between portfolios’ assets. These algorithms and consequently the portfolios utilizing such methods offer flexibility and short response times to changing market conditions.
Keep in mind that a good diversified selection of portfolios’ assets is a prerequisite for such algorithms to succeed in finding the optimum balance between assets.
Portfolio Leveraging
To improve the portfolio’s performance further, portfolios’ returns can be enhanced further using dynamic methods to increase portfolio leverage when markets are calm and volatility is low. This occurs typically in the early and mid-stages of bull markets. When volatility is high which is in early stage of bear markets portfolio leverage is scaled down dynamically.
Enriching the Portfolio’s Asset Selection Further Other assets can be included in the portfolio in order to broaden the portfolio’s spectrum monitored. In this way, returns can be boosted further while maintaining low levels of volatility.
Types of Investment strategies
There are two types of investment approaches: discretionary investing and systematic investing.
The Systematic approach relies solely on signals produced by data analysis. Signals are generated from pattern recognition of market data and/or fundamental analysis of economic and corporate data.
The discretionary approach relies on the subjective judgement of investor. It is in the investor’s discretion to decide which market to trade, when to trade, and how much to risk.
Investors often follow a hybrid approach either following a systematic approach with a discretionary overlay or a discretionary approach with a systematic signal generation overlay.
Investors should analyse any investment or investment strategy or fund by using the investment criteria discussed
below.
Investment strategies timeframes
An investment strategy has a timeframe on which it operates and exploits market anomalies to capture profits. Timeframes can range from milliseconds to years.High-Frequency Trading Strategies operate in a short-term horizon ranging from intraday (microseconds) to several days. They exploit structural effects in the marketplace, statistical relationships between financial instruments or information flow. They use big leverage which can often be very risky, and their success is dependent on market microstructure inefficiencies which decay fast over time removing opportunities for profit.
Mean Reversion strategies operate in the short to medium-term horizons and they exploit the mean reverting behaviour of some financial instruments under special conditions. The theory suggests that prices move back towards the mean or average. Statistical stationarity and cointegration are key principles to determine the mean reversion likelihood of prices of financial instruments.
Momentum Investing Strategies operate in the medium-term horizon ranging from weeks to several months and they exploit the momentum structural anomaly. Momentum is caused by human behaviour who usually choose to follow the crowd rather than act against it. As a result, investments keep moving in the same direction for several weeks as rising prices attract buyers while falling prices attract sellers. Academic research has shown momentum to be a valid strategy from the early 1800s up to the present and across nearly all asset classes.
Value Investing Strategies look for stocks with strong fundamentals including earnings, dividends, book value and cash flow selling at bargain prices relative to their true value (quality). The value investor seeks to find stocks of undervalued companies having the potential to increase when the market recognizes the stock's true value. The big drawback of value investing strategies is their long-term horizon and their inconsistency of returns, which leads most value strategies to generate low sharpe-ratios (less than 1), big maximum drawdowns and high risk.
This is a brief summary of different types of investments strategies used by hedge funds.
- Long Short Equity Investment Strategies
- Long Short Value This strategy requires investing in equities the portfolio manager believes are cheap/undervalued by the market. Typically they look for equities having discounted valuation multiples or generate high free cash flow.
- Long Short Growth This investment strategy focuses on investing in companies based on growth prospects. Fund managers look at companies' earnings growth and capital appreciation.
- Sector Focused / Niche These strategies focus on investing in specific sectors (healthcare, tech, energy and materials), geographies, or companies of certain market cpaitalization (small, medium, large cap).
- Short Funds These strategies focus on identifying companies that are overvalued based on various investment criteria including expectations, bad management, fraud etc
- Multi Strategy Long Short Equity These funds use a mix of the investment strategies described above.
- Event Driven Investment Strategies
- Activist These funds invest in the company's equity capital to obtain board representation in order to influence specific decisions in the company's management like asset changes, divestitures, buybacks, board modification.
- Special Situations These funds focus on investing in the equity of companies involved in some type of situation like sale, issuance or spin-off.
- Distressed These funds focus on trading corporate credit at a discount due to bankruptcy. They involve negotiations with management and creditor committees to negotiate the outcome.
- Merger Arbitrage These funds invest in equity companies undergoing some type of corporate transaction typically a merger or acquisition.
- Multi Strategy Event driven funds These funds use a mix of investment strategies described above.
- Macro Investment Strategies
- Active Trading These strategies include both systematic and discretionary approaches to investing and positioning is based on macro analysis. These strategies require rapid response to market conditions.
- Commodity trading These strategies use a mix of market data, systematic and/or technical analysis. They focus on investing in commodities like metals, agriculture, energy or some mix of these.
- Currency trading These strategies use a mix of approaches like systematic (algorithmic) or discretionary. They use a top down macro analysis and also identify trends and momentum across the asset classes monitored.
- Thematic trading These strategies use algorithms to determine a position's size based on certain risk constraints or a discretinary approach where the management team decides portfolio positions based on top down approach.or discretionary apporach
- Multi strategy macro investing These strategies use a mix of investment strategies described above
- Relative value investment strategies
- Market Neutral Equities This strategy requires maintaining a net equity exposure from 0-10%. It also includes factor based trading strategies and statistical arbitrage. Manaers use quantitative techniques to evaluate which positions to buy and sell.
- Fixed Income Relative Value These strategies focus capturing a spread differential. They invest in different asset classes including corporate credit, sovereight debt, convertible arbitrage.
- Convertible arbitrage This investment strategy is a subset of fixed income relative value and seeks to profit from the spread between convertible and non-convertible securities of a specific issuer.
- Volatility This strategy involves investing in volatility instruments of various asset classes
- Risk Parity Investment strategies These funds are focused on risk allocation across different asset classes to manage a diversified investment portfolio based on desired level of portfolio volatility. MacroVar offers a free guide to manage your investment portfolio based on risk parity for free.
- Fund of Funds These funds invest in various other funds with uncorrelated strategies.
- Crypto and/or blockchain investing These strategies involve investing in crypto directly or by investing in crypto infrastructure plays like storage, new platforms and decentralized computing.
Alternatively, if you are interested in structuring your systematic low-risk investment strategy based on risk parity without relying on financial advisors and investment firms check our asset allocation guide.