Unlocking the Meaning of Volatility: A Comprehensive Guide
What is Volatility
Volatility describes the degree to which an investment’s value moves up and down. Market Volatility is the most important variable in portfolio management and investing.
Depending on market volatility conditions and future expectations, portfolio managers switch between investing and trading roles. During periods of low market volatility expectations, portfolio managers structure their portfolios with long-term investments with timeframes of one to three months. If portfolio managers expect rising market volatility, they adjust their investment portfolios by reducing exposure of their long-term positions and focusing on identifying short-term trades with timeframes of one to five days. Position sizes are also reduced.
Volatility Example
A portfolio manager manages a $1,000,000 portfolio of US Stocks. During low market volatility conditions (VIX levels of 14%), the portfolio’s volatility of the Profit / Loss is 0.40% or $1,000,000 x 0.004 = $4,000. If the expected volatility doubles to 28% annualized, the Profit / Loss doubles from $4,000 to $8,000. To avoid rising risk, portfolio managers reduce their exposure by 50% and use the existing funds to find short-term trading opportunities.
Volatility Analysis
Portfolio managers monitor the global economy and market conditions, to predict market volatility for the next one to three months. When the global economy or market conditions, show increased probability of high volatility, successful portfolio managers de-risk before the rest of the market and then use the remaining funds to take advantage of short-term opportunities.
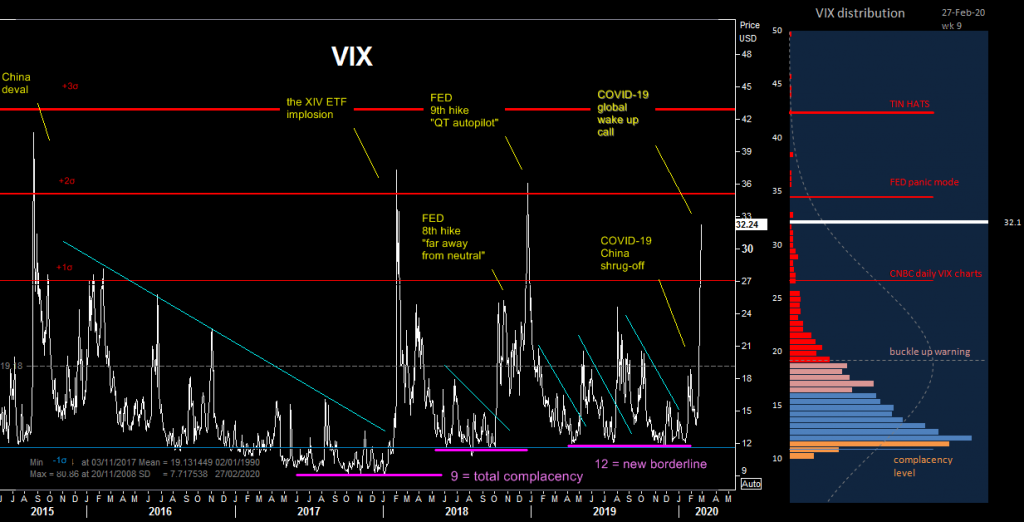
The most important implied volatility metric used to monitor market expectations on future market risk is the VIX. VIX presents the expected move in the S&P 500 index over the upcoming 30-day period. A VIX of 14 means the market expects an annualized expected change of 14% over the next 30 days. Hence, the S&P 500 is expected to move up or down by 4.04% over the next 30-day period (14% / √12)
Low volatility periods are characterized by VIX values less than or equal to 15. Low volatility periods have historically occurred 80% of the time.
High volatility periods are characterized by VIX values equal or higher than 20. High volatility periods have historically occurred 20% of the time.
Extremely high implied volatility means extremely high uncertainty in either direction. Oversold markets can snap back as fast as they dropped.
This means that successful portfolio managers are portfolio managers 80% of the time and day traders 20% of the time.

MacroVar monitors current VIX levels versus VIX historical z-score values. VIX levels represent different market volatility environments:
- VIX less than or equal to 12: Extremely “artificially” low volatility environment, often leading to volatility surprises in the near future
- VIX greater than 12 and lower than 16 (1 z-score): low volatility environment, which has historically coincident with good stock market performance
- VIX greater than 16 and lower than 18: medium volatility environment, warning of rising volatility
- VIX great than 18: high volatility environment, high risk
MacroVar monitors the following factors which have historically predicted future VIX levels:
- VIX seasonality
- VIX Commitment of Traders Report
- VIX compared to US 2s10s yield curve
- VIX versus CDX (credit default swap index)
- VIX versus LIBOR-OIS spread
- VIX versus US Manufacturing PMI
You can monitor the current VIX levels and factors affecting the VIX by clicking VIX Chart.
VIX is one of the major tools used in portfolio management. VIX is combined with VIX volatility term structure and VSTOXX which is used to monitor European equity risk. Check our guide on portfolio management to identify trading opportunities across all asset classes.
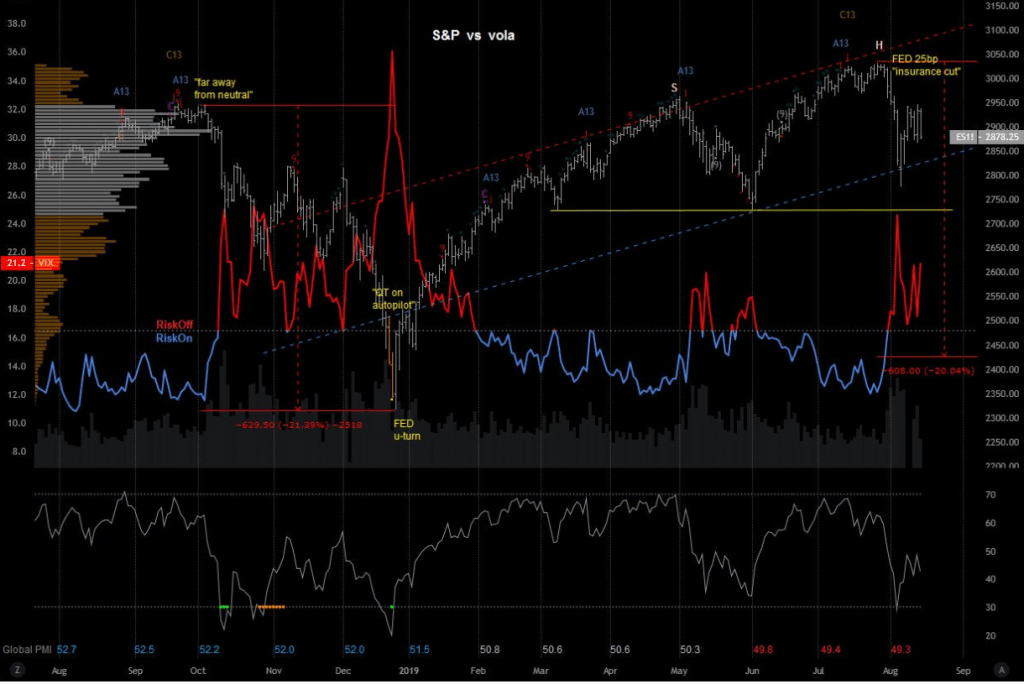
S&P 500 and Volatility
Historically VIX levels of less than 17 have coincided with risk on periods and good stock market performance. VIX levels higher than 17 have indicated high risk and poor stock market performance.
