Long Short Strategy
Explore long short strategies and opportunities using MacroVar models analyzing long short returns, value, momentum and trends across global equity markets, sectors and industries across US, Europe and Asia. Explore an in depth overview of MacroVar models used in identifying long short opportunities.
Stocks
| Spreads vs ACWI ETF | |||||||
|---|---|---|---|---|---|---|---|
| Last | M | T | E | 1w % | 1M % | ||
AustriaEWO | 25.53 | 100 | 100 | ||||
NetherlandsEWN | 49.77 | 2 | 3 | ||||
NigeriaNGE | 12.47 | 2 | 3 | ||||
SwedenEWD | 48.14 | 2 | 3 | ||||
ChinaFXI | 46.21 | 2 | 3 | ||||
TaiwanEWT | 63.6 | 2 | 3 | ||||
| 55.44 | 2 | 3 | |||||
JapanEWJ | 68.86 | 2 | 3 | ||||
Hong KongEWH | 27.03 | 2 | 3 | ||||
South KoreaEWY | 92.97 | 2 | 3 | ||||
NorwayENOR | 29.88 | 2 | 3 | ||||
TurkeyTUR | 23.11 | 2 | 3 | ||||
New ZealandENZL | 61.74 | 2 | 3 | ||||
South AfricaEZA | 52.35 | 2 | 3 | ||||
USSPY | 425.26 | 2 | 3 | ||||
IndiaINDA | 45.2 | 2 | 3 | ||||
IndonesiaEIDO | 21.95 | 2 | 3 | ||||
VietnamVNM | 20.18 | 2 | 3 | ||||
ChileECH | 29.91 | 2 | 3 | ||||
PortugalPGAL | 12.0 | 2 | 3 | ||||
DenmarkEDEN | 108.71 | 2 | 3 | ||||
UKEWU | 33.77 | 2 | 3 | ||||
RussiaRSX | 29.52 | 2 | 3 | ||||
AustraliaEWA | 27.05 | 2 | 3 | ||||
PeruEPU | 30.05 | -100 | 3 | ||||
MexicoEWW | 48.97 | 2 | 3 | ||||
BrazilEWZ | 19.89 | 2 | 3 | ||||
GreeceGREK | 29.92 | 2 | 3 | ||||
ItalyEWI | 33.74 | 2 | 3 | ||||
ThailandTHD | 82.24 | 2 | 3 | ||||
FranceEWQ | 39.18 | 2 | 3 | ||||
PolandEPOL | 22.18 | 2 | 3 | ||||
SpainEWP | 30.36 | 2 | 3 | ||||
SingaporeEWS | 23.7 | 2 | 3 | ||||
EurozoneEZU | 51.11 | 2 | 3 | ||||
PhilippinesEPHE | 31.58 | 2 | 3 | ||||
GermanyEWG | 35.68 | 2 | 3 | ||||
CanadaEWC | 37.99 | 2 | 3 | ||||
SwitzerlandEWL | 49.73 | 2 | 3 | ||||
MalaysiaEWM | 26.61 | 2 | 3 | ||||
US Spreads vs Stoxx 600 Benchmark
| US Spreads vs Stoxx 600 Benchmark | ||||||
|---|---|---|---|---|---|---|
| US STOXX Sectors | Last | M | T | E | 1w % | 1M % |
TechnologySX8P | 3.66 | 2 | 3 | |||
HealthCareSXDP | 1.27 | 2 | 3 | |||
Autos & PartsSXAP | 1.08 | 2 | 3 | |||
MediaSXMP | 1.25 | 2 | 3 | |||
Real EstateSX86P | 0.24 | 2 | 3 | |||
| 0.87 | 2 | 3 | ||||
Oil & GasSXEP | 0.35 | 2 | 3 | |||
UtilitiesSX6P | 0.27 | 2 | 3 | |||
BanksSX7P | 0.63 | 2 | 3 | |||
| 2.11 | 2 | 3 | ||||
ChemicalsSX4P | 0.82 | 2 | 3 | |||
RetailSXRP | 1.99 | 2 | 3 | |||
Basic ResourcesSXPP | 0.21 | 2 | 3 | |||
| 1.02 | 2 | 3 | ||||
Travel & LeisureSXTP | 1.38 | 2 | 3 | |||
InsuranceSXIP | 0.71 | 2 | 3 | |||
TelecomSXKP | 0.22 | 2 | 3 | |||
Food & BeverageSX3P | 0.7 | 2 | 3 | |||
| 1.17 | 2 | 3 | ||||
| EU Spreads vs Stoxx 600 Benchmark | ||||||
|---|---|---|---|---|---|---|
| Europe STOXX Sectors | Last | M | T | E | 1w % | 1M % |
Financial ServicesSXA1FSV | 1.51 | 2 | 3 | |||
MediaSXA1MDI | 0.72 | 2 | 3 | |||
TechnologySXA1TEC | 1.58 | 2 | 3 | |||
Basic ResourcesSXA1BAS | 1.31 | 2 | 3 | |||
Autos & PartsSXA1ATO | 1.47 | 2 | 3 | |||
RetailSXA1RTS | 1.04 | 2 | 3 | |||
TelecomSXA1TLS | 0.52 | 2 | 3 | |||
HeatlhCareSXA1HCR | 2.12 | 2 | 3 | |||
Ind. Goods & ServSXA1IGS | 1.59 | 2 | 3 | |||
Oil & GasSXAENL | 0.59 | 2 | 3 | |||
UtilitiesSXA1UTI | 0.84 | 2 | 3 | |||
Travel & LeisureSXA1CGS | 0.59 | 2 | 3 | |||
ChemicalsSXA1CHM | 2.68 | 2 | 3 | |||
Real EstateSXAREL | 0.41 | 2 | 3 | |||
Food & BeverageSXATFV | 1.74 | 2 | 3 | |||
BanksSXA1BNK | 0.3 | 2 | 3 | |||
InsuranceSXA1INS | 0.66 | 2 | 3 | |||
Constr & MatSXA1CNS | 1.31 | 2 | 3 | |||
Pers & HH GoodsSXAPDV | 2.34 | 2 | 3 | |||
US ETF Spreads Overview/h6>
| US ETF Spreads Overview | ||||||
|---|---|---|---|---|---|---|
| Last | M | T | E | 1w % | 1M % | |
Bonds / StocksTLT/SPY | 0.33 | 2 | 3 | |||
Momentum / ValueMTUM/VLUE | 1.6 | 2 | 3 | |||
Cons Discr / StaplesXLY/XLP | 2.44 | 2 | 3 | |||
Industrials / UtilitiesXLI/XLU | 1.56 | 2 | 3 | |||
Small Caps / Large CapsIWM/SPY | 0.54 | 2 | 3 | |||
Copper / GoldCOPX/GDX | 1.04 | 2 | 3 | |||
Nasdaq / S&P 500QQQ/SPY | 0.81 | 2 | 3 | |||
Tech / Small CapsQQQ/IWM | 1.49 | 2 | 3 | |||
Dow30 / S&P 500DIA/SPY | 0.81 | 2 | 3 | |||
Emerging Markets / S&P 500EEM/SPY | 0.13 | 2 | 3 | |||
US Sector ETFs
| US Sector ETFs | ||||||
|---|---|---|---|---|---|---|
| Last | M | T | E | 1w % | 1M % | |
US RetailXRT | 95.83 | 2 | 3 | |||
US TelecomXTL | 102.38 | 2 | 3 | |||
| 69.17 | 2 | 3 | ||||
| 143.41 | 2 | 3 | ||||
US BioTechIBB | 161.84 | 2 | 3 | |||
| 67.47 | 2 | 3 | ||||
| 124.66 | 2 | 3 | ||||
| 80.78 | 2 | 3 | ||||
| 64.5 | 2 | 3 | ||||
US BanksKBE | 52.86 | 2 | 3 | |||
| 173.26 | 2 | 3 | ||||
| 96.29 | 2 | 3 | ||||
| 102.88 | 2 | 3 | ||||
US UtilitiesXLU | 66.25 | 2 | 3 | |||
| 70.11 | 2 | 3 | ||||
| 87.55 | 2 | 3 | ||||
US EnergyXLE | 55.14 | 2 | 3 | |||
| 17.57 | 2 | 3 | ||||
| 39.51 | 2 | 3 | ||||
| 45.88 | 2 | 3 | ||||
| 21.94 | 2 | 3 | ||||
| 37.17 | 2 | 3 | ||||
| 85.06 | 2 | 3 | ||||
| 265.28 | 2 | 3 | ||||
| 103.04 | 2 | 3 | ||||
US InsuranceKIE | 39.23 | 2 | 3 | |||
| 111.24 | 2 | 3 | ||||
| 38.03 | 2 | 3 | ||||
| 70.9 | 2 | 3 | ||||
Long Short Strategies Overview
This section of MacroVar platform monitors the relative value of global stock markets and US and European stock market sectors to identify long short opportunities across markets using
similar methodologies implemented by long short hedge funds.
The aim of any investor managing an active portfolio is to maximize the returns gained for the minimum risk taken. Get an overview of portfolio management.
Long short strategies are structured using the steps below:
- Global View The first step is to forecast global economic growth using leading macroeconomic indicators, global liquidity, financial markets and financial risk monitors
- Country View Once global view is formed, analysis of countries' macroeconomic fundamentals and financial conditions will determine which countries will outperform or underperform the market
- Sector View Once global view is formed, each economic sector is analyzed based on the sector's position in the supply chain and whether this sector outperforms or underperform the market based on Global view
- Stock View Once sector view formed, each stock's fundamentals (the most common indicator used for this analysis are relative p/e) are analyzed to determine whether this stock will outperform or undeperform the sector's performance
- Long Short Portfolio structure A diversified investment portfolio is structured by selecting assets with market risk, country risk, sector risk or stock risk exposure
Any investment position of a portfolio is exposed to the following risks:
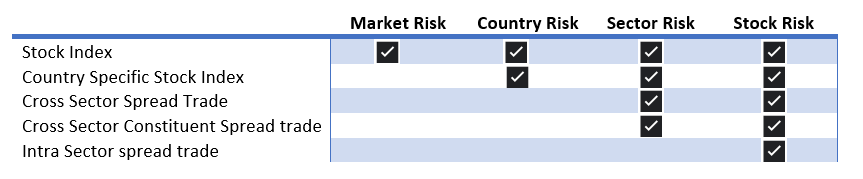
Investing in a stock index like the S&P 500 is exposed to market risk, sector risk and stock specific risk. A cross country spread trade has no market risk but is exposed to country risk, sector and stock risk. A cross sector spread trade hedges the market risk and is exposed to sector and stock specific risk. An intra sector constituent spread trade has no market risk, no sector risk but is exposed to stock specific risk.
Check below how an investor can make a higher % return for every unit of risk vs the market return:
- Market Returns: Market return is the annual return of the S&P 500. When an investor buys the S&P 500 it
- Cross Country Spread Trade: Example: Long German DAX Indx, Short Greek Index
- Cross Sector Spread Trades: Example: Long S&P 500 Consumer Discretionary, Short S&P 500 Utilities Sectors
- Cross Sector constituent spread trades:Example: Long Apple, Short BP
- Intra Sector constituent spread trade:Example: Long Apple, Short Nokia
MacroVar financial and macroeconomic top down approach and risk management models are used to forecast global economic growth and financial conditions. Based on these forecasts, long short hedge funds determine the net exposure of an investment portfolio that is whether to be net long, net short or neutral. For example, when global economic growth has bottomed after a recession and leading indicators like Global PMI stop falling, successful hedge funds go long cyclicals. Conversely, when global economic growth slows for the first time hedge funds buy defensive and look to go short cyclicals.
Country Long Short Strategy
The stock markets of each country is correlated to the world overall stock market index performance. This is measured by the each country's stock market index beta relative to the world stock market index (ACWI). However, every country stock market index tends to outperform or underperform the world stock market index based on the country's macroeconomic fundamentals and financial conditions. For example, the UK's FTSE 100 stock market index is heavily weighted with commodity related companies hence tends to outperform the global market during global economic booms and underperform during recessions. The same is true for the Russian stock market which is reliant on oil & gas companies. A specific country's stock market index is also affected by the country's macroeconomic fundamentals. For example, Turkey has severe economic problems mainly related to its external debt. During periods of capital flight where foreign capital is living the country, the specific country's stock market tends to severely outperform the world stock market index.
MacroVar models monitor each country's stock market trend relative to the world stock market index by monitoring the country's spread (country ETF index divided by the World stock market ETF index (ACWI)) to detect which markets outperform and underperform.
This monitor allows you to sort by country's stock market index momentum, trend, oscillator, weekly or monthly returns to identify long short opportunities. By default, world stock markets are sorted based on their momentum strength. The easiest way to use this monitor is buy the top 5 country ETFs with the strongest momentum and go short the bottom 5 country ETFs with weakest momentum. Of course, other factors must be monitored like the country's fundamentals, other financial markets like the bond market and country risk.
Sector Long Short Strategy
MacroVar monitors and reports the relative value of US Stock market indexes using the STOXX indexes and the US Stock ETFs. Moreover, it monitors the European stock market index using the STOXX stock market indices. The hedge funds based on their overall investment portfolio exposure structure their portfolios by selecting a combination of cyclical and defensive sectors. There are fundamental factors affecting the demand and supply of each sector based on the sector's position in the value chain presented below.
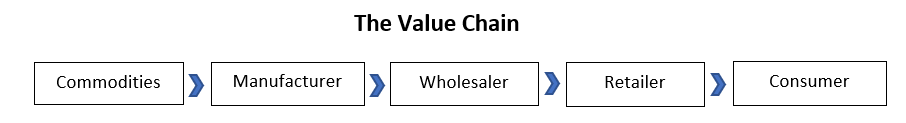
For example a supply shock will cause a severe price increase in goods produced and will end up affecting the retailer with a lag of three to six months. A demand problem on the other hand will hit the manufacturer within six months.
Cyclical vs Defensive Sectors
- Cyclical sectors are sectors whose earnings are more sensitive to the business cycle.
- Defensive sectors are sectors whose earnings are less sensitive to the business cycle
Stock Specific Long Short Strategy
Stock fundamental analysis is used to identify intra sector spread trade opportunities. The most common important metrics are relaive P/E and PE of stocks in a specific sector or industry.
Long Short funds
Long short funds are categorized as long short value, long short growth, market neutral, sector focused, short funds and mult-strat. These are analyzed below:- Long Short Value: These funds invest in equities portfolio managers believe are cheap/undervalued by the market. They typically look at discounted valuation multiples or generate high free cash flows.
- Long Short Growth: These funds invest in companies based on growth prospects. Typically they look at companies' earnings grwoth and capital appreciation.
- Market Neutral: These funds maintain net equity exposure from 0-10%, can also include factor-based and statistical arbitrage trading strategies. They use quantitative techniques to evaluate buy/sell positions.
- Sector Focused: The funds invest in specific sectors (healthcare, technology, energy, materials) or by geogrpahy, market cap (small, medium, large, mega).
- Short funds: The funds identify companies that are overvalued, either due to expectations, bad management or fraud.
- Multi-Strat: Theese funds use a mix of the strategies analyzed above
Momentum is used to capture moves in shorter timeframes than trends. Momentum is the relative change occurring in markets. Relative change is different to a trend. A long-term trend can be up but the short-term momentum of a specific market can be 0. If a market moves down and then moves up and then moves back down the net relative change in price is 0. That means momentum is 0. A short-term positive momentum, with a long-term downtrend results in markets with no momentum.
MacroVar analyzes the momentum of spreads to determine long short trading opportunities by estimating a signal ranging from -100 to +100. The momentum signal is derived as the mean value from 4 calculations for each long short spread monitored. The timeframes monitored are the following: 1 Day (1 trading day), 1 Week (5 trading days), 1 Month (20 trading days), 3 Months (60 trading days). For each timeframe, the following calculations are performed: 1. the spread's return is calculated for the specific timeframe and 2. if the return calculated is higher than 0, signal value output is 1 else signal value is -1. The spread's momentum signal is the aggregate of the the 4 values. A technical momentum rollover is identified when the spread's momentum signal moves from positive to negative value or vice-versa.
Long Short trend analysis
A long short spread's trend signal ranges from -100 to +100. A spread's trend indicator is the mean value of the 8 calculations described below. The timeframes monitored are the following: 1-month (20 trading days), 3-months (60 trading days), 6-months (125 trading days), 1-year (250 trading days) For each timeframe, the following calculations are performed: 1. the spread's Closing price vs the spread's moving average (MA) calculation: If the spread's closing price is greater than the spread's MA value is +1, else -1, 2. the spread's Moving average slope calculation: if current spread's moving average is higher than the previous MA, spread's upward slope +1, else -1 spread trend model can be used as a trend strength indicator. Spread trend strength values ranging between +75 and +100 or -75 and -100 show strong trend strength. A technical trend rollover is identified when the spread's strength indicator moves from positive to negative value or vice-versa.
The most important trend indicator: A spread's 52-week simple moving average and its slope are the most important indicators defining a market’s trend. A spread is in an uptrend when the spread's price is higher than the 52-week moving average and the spead's 52-week moving average has an upward slope. If fundamentals of the market have not changed and the moving average slope is still in uptrend, a price drop signifies a market correction and not a change of trend. Traders should watch oscillators like the spread's oscillator and spread's RSI to buy the dip and still follow the trend. The moving average slope turn signifies a change of trend.
Long Short trend exhaustion
The spread's oscillator estimated by MacroVar is the z-score of the current spread's price versus the spread's 1-year simple moving average price. The formula for the spread's oscillator is:
spread's oscillator = (Current Price – 250 trading days simple moving average price) / (250 days price standard deviation)
Oversold conditions
A spread is oversold when it is subject to a persistent downward pressure due to extreme fund outflows. When the spread is oversold it is often due for a rebound. Values of the spread oscillator lower than -2.5 signify oversold conditions. It must be noted that the spread oscillator must be analyzed ibn conjunction with the rest of spread quantitative factors. Traders should pay less attention to overbought or oversold conditions during strong trends. They should pay close attention during counter trends and all combined with the spread RSI.
Overbought conditions
A spread is overbought when it is subject to a persistent upward pressure due to extreme fund inflows. When the spread is overbought it is often due for a correction. Values of the spread oscillator higher than +2.5 signify overbought conditions. It must be noted that the MacroVar oscillator must be compared to the rest of the spread quantitative factors. Traders should pay less attention to overbought or oversold conditions during strong trends. They should pay close attention during counter trends and all combined with the RSI.