World Economy Outlook
Stay informed with our comprehensive World Economy Monitor and real-time economic calendar designed to keep you up-to-date with the dynamics of the world's 40 largest economies. MacroVar also provides free data access and research for more than 40,000 economic & financial indicators of the world's largest economies.
Explore how to interpret Economic data of the table and the World macroeconomic model. Select a specific country to explore real-time analysis of the latest market, macroeconomic and news developments of the country.
Explore how to interpret Economic data of the table and the World macroeconomic model. Select a specific country to explore real-time analysis of the latest market, macroeconomic and news developments of the country.
| cnid | Country | Manufacturing | YY% | MM% | Services | MM% | YY% | GDP | GDP (Y/Y) | CPI | CB | CB B/S YoY | Gov Fin. | Debt/GDP | CA | UE |
|---|---|---|---|---|---|---|---|---|---|---|---|---|---|---|---|---|
| 1 | Global Economy | 49,40 | 52,90 | -2 | 4 | 2,93 | 4,66 | |||||||||
| 2 | USA | 48,50 | 53,30 | -3 | 6 | 27.360 | 2,80 | 2,60 | 4,75 | 0,03 | -6,20 | 122,30 | -3,00 | 4,10 | ||
| 3 | Eurozone | 46,00 | 7 | 2 | 51,60 | 0 | 8 | 15.544 | 0,40 | 2,00 | 3,40 | -1,00 | -3,60 | 87,40 | 1,70 | 6,30 |
| 4 | China | 50,30 | 52,10 | 2 | -4 | 17.794 | 0,90 | 0,30 | 3,10 | 6,00 | -5,80 | 83,60 | 1,50 | 5,00 | ||
| 6 | Canada | 50,40 | 2.140 | 0,50 | 1,60 | 3,75 | -14,00 | -1,40 | 107,50 | -0,60 | 6,50 | |||||
| 7 | Brazil | 53,20 | 56,40 | 2.173 | 1,40 | 4,76 | 11,25 | -8,90 | 74,42 | -1,42 | 6,40 | |||||
| 8 | Mexico | 47,30 | 1.788 | 1,00 | 4,76 | 10,50 | 23,00 | -5,00 | 49,70 | -1,50 | 2,90 | |||||
| 10 | Germany | 43,00 | 5 | 6 | 51,60 | 2 | 7 | 4.456 | 0,20 | 2,00 | 3,40 | 0,00 | -2,50 | 62,90 | 5,90 | 6,10 |
| 11 | France | 44,50 | 4 | 0 | 49,20 | -1 | 9 | 3.030 | 0,40 | 1,20 | 0,80 | -9,00 | -5,50 | 110,60 | -1,00 | 7,40 |
| 12 | Italy | 46,90 | 4 | -3 | 52,40 | 4 | 5 | 2.254 | 0,00 | 0,90 | 3,40 | -11,00 | -7,20 | 134,60 | 0,00 | 6,10 |
| 13 | Spain | 54,50 | 21 | 3 | 54,90 | -4 | 11 | 1.580 | 0,80 | 1,80 | 3,40 | -5,00 | -3,60 | 107,70 | 2,70 | 11,21 |
| 14 | Netherlands | 48,20 | 1.118 | 0,80 | 3,50 | 0,80 | -17,00 | -0,90 | 46,80 | 9,90 | 3,70 | |||||
| 15 | Austria | 42,00 | 516 | -0,10 | 1,80 | 0,80 | -2,00 | -2,70 | 77,80 | 1,30 | 6,90 | |||||
| 16 | Greece | 50,80 | 238 | 1,10 | 2,40 | 0,80 | -3,00 | -1,60 | 161,90 | -6,20 | 9,30 | |||||
| 17 | Denmark | 45,68 | 404 | 1,10 | 1,60 | 2,85 | 6,00 | 3,10 | 29,30 | 9,80 | 2,60 | |||||
| 18 | Sweden | 51,30 | 49,10 | 593 | -0,10 | 1,60 | 2,75 | -12,00 | -0,60 | 31,50 | 6,50 | 8,20 | ||||
| 19 | Norway | 51,80 | 485 | 1,40 | 2,60 | 4,50 | 26,00 | 16,30 | 44,30 | 17,50 | 4,00 | |||||
| 20 | Switzerland | 49,90 | 884 | 0,70 | 0,60 | 1,00 | 0,50 | 38,30 | 7,60 | 2,50 | ||||||
| 21 | UK | 49,90 | 51,80 | -1 | 5 | 3.340 | 0,50 | 1,70 | 4,75 | -4,00 | -4,40 | 97,60 | -3,30 | 4,00 | ||
| 22 | Russia | 49,50 | 51,60 | 2 | -10 | 2.021 | -0,80 | 8,50 | 21,00 | -1,90 | 14,90 | 2,50 | 2,40 | |||
| 23 | Turkey | 44,30 | 1.108 | 0,10 | 48,58 | 50,00 | 44,00 | -5,20 | 29,50 | -4,00 | 8,60 | |||||
| 24 | Poland | 49,20 | 11 | 1 | 811 | -0,20 | 5,00 | 5,75 | 5,00 | -5,10 | 49,60 | 1,80 | 5,00 | |||
| 25 | Hungary | 47,60 | -7 | -4 | 212 | -0,70 | 3,20 | 6,50 | 8,00 | -6,70 | 73,40 | 0,80 | 4,60 | |||
| 26 | Czechia | 46,00 | 330 | 0,30 | 2,80 | 4,00 | 9,00 | -3,70 | 44,00 | 0,20 | 3,80 | |||||
| 27 | South Africa | 52,80 | 377 | 0,40 | 3,80 | 8,00 | -4,90 | 72,20 | -1,60 | 32,10 | ||||||
| 28 | Japan | 49,00 | 1 | -1 | 49,70 | -6 | -4 | 4.212 | 0,70 | 2,50 | 0,25 | 2,00 | -5,50 | 255,20 | 3,60 | 2,40 |
| 29 | Australia | 47,30 | -2 | 1 | 51,00 | 1 | 0 | 1.723 | 0,20 | 2,80 | 4,35 | -1,00 | 0,90 | 43,80 | -1,60 | 4,10 |
| 30 | New Zealand | 45,80 | 7 | -2 | 45,70 | 253 | -0,20 | 2,20 | 4,75 | -15,00 | -2,40 | 39,30 | -6,90 | 4,80 | ||
| 31 | Singapore | 51,00 | 501 | 2,10 | 2,00 | 0,80 | -1,60 | 167,80 | 19,80 | 1,80 | ||||||
| 33 | Hong Kong | 50,00 | 382 | -1,10 | 2,20 | 5,00 | 8,65 | -5,00 | 38,40 | 7,10 | 3,00 | |||||
| 34 | India | 57,40 | 0 | 2 | 58,50 | 1 | 0 | 3.549 | 1,30 | 6,21 | 6,50 | 22,00 | -5,63 | 81,59 | -1,20 | 7,80 |
| 35 | Indonesia | 49,20 | 1.371 | 1,50 | 1,71 | 6,00 | 8,65 | -1,65 | 39,30 | -0,30 | 4,91 | |||||
| 36 | South Korea | 48,30 | 1.712 | 0,10 | 1,30 | 3,25 | 3,00 | -2,60 | 51,50 | 11.120,00 | 2,50 | |||||
| 37 | Malaysia | 49,50 | 399 | 2,90 | 1,80 | 3,00 | -3,00 | -5,00 | 61,10 | 2,70 | 3,20 | |||||
| 38 | Taiwan | 50,80 | 774 | 0,29 | 1,69 | 2,00 | 0,00 | -0,50 | 28,20 | 11,80 | 3,38 | |||||
| 39 | Philippines | 52,90 | 1 | -1 | 437 | 1,70 | 2,30 | 6,00 | 9,00 | -6,20 | 60,10 | -1,30 | 3,70 | |||
| 40 | Thailand | 50,40 | 514 | 0,80 | 0,83 | 2,25 | 3,00 | -2,80 | 61,90 | -0,20 | 1,07 | |||||
| 41 | Vietnam | 47,30 | 429 | 6,88 | 2,89 | 4,50 | 8,65 | -4,00 | 37,10 | 0,20 | 2,24 | |||||
| 42 | Portugal | 43,20 | 287 | 0,20 | 2,30 | 0,80 | 0,00 | 1,20 | 99,10 | 1,40 | 6,40 |
World Economic calendar
Monitor real-time economic events and news using MacroVar economic calendar.
tet1
| Time | Imp | Event | Country | Actual | Previous | Forecast |
|---|---|---|---|---|---|---|
| 24/11 21:45 | balance of trade | New Zealand | NZ$-2.108B | NZ$ -2.0B | ||
| 24/11 21:45 | exports | New Zealand | NZ$5.01B | NZ$5.1B | ||
| 24/11 21:45 | imports | New Zealand | NZ$7.12B | NZ$7.2B | ||
| 24/11 21:45 | retail sales mom | New Zealand | -1.2% | 0.6% | ||
| 24/11 21:45 | retail sales yoy | New Zealand | -3.6% | 2% | ||
| 25/11 03:30 | balance of trade | Thailand | $0.39B | |||
| 25/11 05:00 | industrial production | Singapore | 9.8% | |||
| 25/11 05:00 | industrial production mom | Singapore | 0% | |||
| 25/11 06:00 | producer prices change | Finland | -2.3% | |||
| 25/11 07:00 | loan growth | Norway | ||||
| 25/11 07:00 | business confidence | Turkey | ||||
| 25/11 07:00 | capacity utilization | Turkey | ||||
| 25/11 08:00 | business confidence | Czech Republic | 96 | |||
| 25/11 08:00 | consumer confidence | Czech Republic | 100.7 | |||
| 25/11 08:00 | producer prices change | Spain | -5.2% | |||
| 25/11 08:00 | industrial production | Taiwan | 11.22% | |||
| 25/11 08:00 | retail sales yoy | Taiwan | 3.2% | |||
| 25/11 08:20 | money supply m2 | Taiwan | 5.6% | |||
| 25/11 09:00 | business confidence | Germany | 86.5 | |||
| 25/11 09:00 | ifo current conditions | Germany | 85.7 | |||
| 25/11 09:00 | industrial production | Poland | -0.3% | |||
| 25/11 09:00 | producer prices change | Poland | -6.3% | |||
| 25/11 09:00 | unemployment rate | Poland | 5% | |||
| 25/11 09:30 | business confidence | Slovenia | -8 | |||
| 25/11 11:00 | balance of trade | Luxembourg | €-0.63B | € -0.7B | ||
| 25/11 11:30 | current account | Brazil | $-6.53B | |||
| 25/11 11:30 | foreign direct investment | Brazil | $5.23B | |||
| 25/11 12:00 | gdp growth rate | Nigeria | 10.0% | |||
| 25/11 12:00 | gdp annual growth rate | Nigeria | 3.19% | 3.2% | ||
| 25/11 14:00 | business confidence | Belgium | -12.8 | |||
| 25/11 15:00 | current account | Mexico | $3639M | $ -5200M | ||
| 25/11 15:30 | dallas fed manufacturing index | United States | -3 | |||
| 25/11 21:00 | consumer confidence | South Korea | 101.7 | 102.2 | ||
| 26/11 00:00 | building permits | United States | ||||
| 26/11 06:00 | unemployment rate | Finland | 8.1% | |||
| 26/11 07:00 | producer prices change | Sweden | -2.3% | |||
| 26/11 08:30 | balance of trade | Hong Kong | ||||
| 26/11 09:00 | retail sales yoy | Poland | -3.0% | |||
| 26/11 15:00 | new home sales | United States | 0.738M | |||
| 26/11 15:00 | richmond fed manufacturing index | United States | -14 | |||
| 26/11 15:00 | richmond fed services index | United States | 3 | |||
| 26/11 16:00 | money supply m2 | United States | $21.22T | |||
| 26/11 19:00 | retail sales yoy | Argentina | 204.4% | 190.0% | ||
| 26/11 21:00 | business confidence | South Korea | 69 | 71 | ||
| 27/11 02:00 | consumer confidence | Taiwan | 77.06 | |||
| 27/11 03:00 | government budget value | Philippines | PHP-273.3B | |||
| 27/11 04:00 | producer prices change | Malaysia | -2.1% | |||
| 27/11 06:00 | business confidence | Finland | ||||
| 27/11 06:00 | consumer confidence | Finland | ||||
| 27/11 07:00 | consumer confidence | Germany | -18.3 | -16 | ||
| 27/11 07:00 | unemployment rate | Norway | 4% | |||
| 27/11 07:00 | loan growth | Sweden | 1% | |||
| 27/11 07:45 | consumer confidence | France | 94 | |||
| 27/11 09:00 | manufacturing pmi | Austria | 42.0 | |||
| 27/11 09:00 | zew economic sentiment index | Switzerland | -7.7 | |||
| 27/11 10:00 | gdp annual growth rate | Croatia | 3.3% | 2.4% | ||
| 27/11 11:30 | money supply m3 | India | ||||
| 27/11 12:00 | balance of trade | Mexico | $-0.58B | |||
| 27/11 12:00 | mortgage rate | United States | ||||
| 27/11 13:30 | durable goods orders | United States | -0.8% | |||
| 27/11 13:30 | durable goods orders ex defense | United States | -1.1% | |||
| 27/11 13:30 | durable goods orders ex transportation | United States | ||||
| 27/11 13:30 | gdp growth rate | United States | 3.2% | |||
| 27/11 16:00 | business confidence | Russia | 7.0 | |||
| 27/11 16:00 | industrial production | Russia | ||||
| 27/11 16:00 | retail sales yoy | Russia | 6.5% | |||
| 27/11 16:00 | unemployment rate | Russia | ||||
| 28/11 00:00 | business confidence | New Zealand | 65.7 | |||
| 28/11 05:30 | business confidence | Netherlands | -3.2 | |||
| 28/11 06:00 | retail sales mom | Estonia | -5.3% | |||
| 28/11 06:00 | retail sales yoy | Estonia | -4.4% | |||
| 28/11 07:00 | retail sales mom | Denmark | 0.1% | |||
| 28/11 07:00 | retail sales yoy | Denmark | 0.5% | |||
| 28/11 07:00 | retail sales yoy | Lithuania | 4.1% | |||
| 28/11 07:00 | balance of trade | Turkey | $-5.13B | |||
| 28/11 07:00 | exports | Turkey | $21.99B | |||
| 28/11 07:00 | imports | Turkey | $27.12B | |||
| 28/11 08:00 | business confidence | Slovakia | -3.3 | |||
| 28/11 08:00 | consumer confidence | Slovakia | -19 | |||
| 28/11 08:00 | core inflation rate | Spain | 2.5% | |||
| 28/11 08:00 | inflation rate | Spain | 1.8% | |||
| 28/11 08:00 | business confidence | Sweden | ||||
| 28/11 08:00 | consumer confidence | Sweden | ||||
| 28/11 09:00 | business confidence | Bulgaria | 13.3 | |||
| 28/11 09:00 | loan growth | Eurozone | 0.7% | 0.7% | ||
| 28/11 09:00 | loans to private sector | Eurozone | 1.1% | 1.1% | ||
| 28/11 09:00 | money supply m3 | Eurozone | 3.2% | 3.2% | ||
| 28/11 09:00 | business confidence | Italy | 85.8 | |||
| 28/11 09:00 | consumer confidence | Italy | 97.4 | |||
| 28/11 09:00 | gdp growth rate | Poland | 1.5% | -0.2% | ||
| 28/11 09:00 | gdp annual growth rate | Poland | 3.2% | 2.7% | ||
| 28/11 09:30 | retail sales mom | Slovenia | -2.6% | |||
| 28/11 09:30 | retail sales yoy | Slovenia | -3% | |||
| 28/11 09:30 | producer prices change | South Africa | 1% | |||
| 28/11 10:00 | industrial production | Cyprus | 1.2% | 3.2% | ||
| 28/11 10:00 | consumer confidence | Eurozone | -12.5 | |||
| 28/11 10:00 | consumer confidence price trends | Eurozone | 10.5 | |||
| 28/11 10:00 | producer prices change | Italy | -2% | |||
| 28/11 10:00 | gdp annual growth rate | Malta | 4.3% | |||
| 28/11 10:30 | inflation rate | Belgium | 3.2% | |||
| 28/11 11:00 | loan growth | Greece | 3.2% | |||
| 28/11 11:00 | retail sales mom | Ireland | 0.5% | |||
| 28/11 11:00 | retail sales yoy | Ireland | 0.2% | |||
| 28/11 11:30 | loan growth | Brazil | 1.2% | |||
| 28/11 11:30 | foreign exchange reserves | Turkey | ||||
| 28/11 12:00 | producer prices change | Brazil | 6.06% | |||
| 28/11 12:00 | business confidence | Spain | ||||
| 28/11 13:00 | inflation rate | Germany | 2% | 1.9% | ||
| 28/11 13:30 | current account | Canada | C$-8.5B | C$-3.0B | ||
| 28/11 13:30 | continuing jobless claims | United States | ||||
| 28/11 13:30 | initial jobless claims | United States | ||||
| 28/11 23:00 | industrial production | South Korea | ||||
| 28/11 23:00 | industrial production mom | South Korea | ||||
| 28/11 23:00 | retail sales mom | South Korea | ||||
| 28/11 23:30 | unemployment rate | Japan | 2.4% | |||
| 28/11 23:50 | industrial production | Japan | -2.8% | |||
| 28/11 23:50 | industrial production mom | Japan | 1.4% | |||
| 29/11 00:00 | government budget value | Mexico | MXN-993.2B | |||
| 29/11 00:00 | money supply m2 | Russia | 18.8% | |||
| 29/11 00:00 | government budget value | South Africa | ZAR-4.38B | |||
| 29/11 02:00 | loans to private sector | Singapore | S$808.8B | |||
| 29/11 02:00 | balance of trade | Vietnam | $1.99B | |||
| 29/11 02:00 | industrial production | Vietnam | 7.0% | |||
| 29/11 02:00 | inflation rate | Vietnam | 2.89% | |||
| 29/11 02:00 | retail sales yoy | Vietnam | 7.1% | |||
| 29/11 04:00 | industrial production | Thailand | -3.51% | |||
| 29/11 05:00 | consumer confidence | Japan | 36.2 | |||
| 29/11 05:00 | producer prices change | Singapore | -7.1% | |||
| 29/11 05:30 | inflation rate | Netherlands | 3.5% | |||
| 29/11 06:00 | gdp growth rate | Estonia | 0.0% | 0.6% | ||
| 29/11 06:00 | gdp annual growth rate | Estonia | -1.0% | 0.2% | ||
| 29/11 06:00 | gdp growth rate | Finland | 0.3% | |||
| 29/11 06:00 | gdp annual growth rate | Finland | -1.2% | |||
| 29/11 06:00 | money supply m3 | South Africa | 7.25% | |||
| 29/11 07:00 | unemployment rate | Denmark | 2.6% | |||
| 29/11 07:00 | retail sales mom | Germany | 1.2% | |||
| 29/11 07:00 | retail sales yoy | Germany | 3.8% | |||
| 29/11 07:00 | money supply m3 | Malaysia | 4.2% | |||
| 29/11 07:00 | retail sales mom | Norway | -0.3% | |||
| 29/11 07:00 | gdp growth rate | Sweden | -0.3% | |||
| 29/11 07:00 | gdp annual growth rate | Sweden | 0.5% | |||
| 29/11 07:00 | retail sales mom | Sweden | -0.1% | |||
| 29/11 07:00 | retail sales yoy | Sweden | 2.7% | |||
| 29/11 07:00 | current account | Thailand | $0.6B | |||
| 29/11 07:00 | gdp growth rate | Turkey | 0.1% | 1.8% | ||
| 29/11 07:00 | gdp annual growth rate | Turkey | 1.9% | |||
| 29/11 07:30 | producer prices change | Hungary | 0.9% | |||
| 29/11 07:30 | unemployment rate | Hungary | 4.6% | |||
| 29/11 07:30 | retail sales mom | Switzerland | -0.5% | |||
| 29/11 07:30 | retail sales yoy | Switzerland | 2.2% | |||
| 29/11 07:30 | retail sales yoy | Thailand | 31.36% | 13.0% | ||
| 29/11 07:45 | gdp growth rate | France | 0.2% | |||
| 29/11 07:45 | gdp annual growth rate | France | 1% | 0.7% | ||
| 29/11 07:45 | inflation rate | France | 1.2% | |||
| 29/11 07:45 | producer prices change | France | -7% | |||
| 29/11 08:00 | gdp annual growth rate | Austria | -0.6% | 1.7% | ||
| 29/11 08:00 | inflation rate | Austria | ||||
| 29/11 08:00 | producer prices change | Austria | -2.6% | |||
| 29/11 08:00 | gdp growth rate | Czech Republic | 0.4% | 0.3% | ||
| 29/11 08:00 | gdp annual growth rate | Czech Republic | 0.6% | 1.3% | ||
| 29/11 08:00 | retail sales mom | Spain | 1% | |||
| 29/11 08:00 | retail sales yoy | Spain | 4.1% | |||
| 29/11 08:00 | business confidence | Switzerland | 99.5 | |||
| 29/11 08:00 | gdp growth rate | Switzerland | 0.7% | 0.5% | ||
| 29/11 08:00 | gdp annual growth rate | Switzerland | 1.8% | 1.1% | ||
| 29/11 08:00 | gdp annual growth rate | Taiwan | 4.8% | |||
| 29/11 08:30 | retail sales yoy | Hong Kong | -8.7% | |||
| 29/11 08:55 | unemployment rate | Germany | 6.1% | |||
| 29/11 09:00 | producer prices change | Bulgaria | -0.8% | |||
| 29/11 09:00 | money supply m3 | Czech Republic | 5.5% | |||
| 29/11 09:00 | foreign exchange reserves | Nigeria | $39.74B | $40.0B | ||
| 29/11 09:00 | inflation rate | Poland | 5% | |||
| 29/11 09:00 | current account | Spain | €5.63B | €4.3B | ||
| 29/11 09:30 | business confidence | Portugal | 2.1 | |||
| 29/11 09:30 | consumer confidence | Portugal | -13.90 | |||
| 29/11 09:30 | inflation rate | Portugal | 2.3% | |||
| 29/11 09:30 | inflation rate | Slovenia | 0% | |||
| 29/11 10:00 | gdp growth rate | Belgium | 0.3% | 0.2% | ||
| 29/11 10:00 | gdp annual growth rate | Belgium | 0.9% | 1.0% | ||
| 29/11 10:00 | industrial production | Croatia | 1% | |||
| 29/11 10:00 | inflation rate | Croatia | 2.2% | |||
| 29/11 10:00 | retail sales mom | Croatia | 2.1% | |||
| 29/11 10:00 | retail sales yoy | Croatia | 7.1% | |||
| 29/11 10:00 | consumer price index cpi | Eurozone | ||||
| 29/11 10:00 | core inflation rate | Eurozone | ||||
| 29/11 10:00 | inflation rate | Eurozone | ||||
| 29/11 10:00 | producer prices change | Greece | -4.5% | |||
| 29/11 10:00 | retail sales yoy | Greece | -5.2% | 1.4% | ||
| 29/11 10:00 | unemployment rate | Greece | 9.3% | |||
| 29/11 10:00 | inflation rate | Italy | 0.9% | 1.2% | ||
| 29/11 10:00 | current account | North Macedonia | $-120.13M | |||
| 29/11 10:00 | unemployment rate | Portugal | 6.4% | |||
| 29/11 10:30 | government budget value | India | ||||
| 29/11 11:00 | producer prices change | Belgium | ||||
| 29/11 11:00 | gdp growth rate | Latvia | -0.9% | |||
| 29/11 11:00 | gdp annual growth rate | Latvia | 0.5% | 2.5% | ||
| 29/11 11:00 | retail sales mom | Latvia | -0.3% | |||
| 29/11 11:00 | retail sales yoy | Latvia | 0.2% | |||
| 29/11 11:00 | producer prices change | Luxembourg | -3.2% | |||
| 29/11 11:00 | industrial production | North Macedonia | -7.9% | |||
| 29/11 11:00 | retail sales yoy | North Macedonia | ||||
| 29/11 11:00 | gdp growth rate | Portugal | 0.2% | 0.2% | ||
| 29/11 11:00 | gdp annual growth rate | Portugal | 1.6% | 1.9% | ||
| 29/11 11:00 | balance of trade | Serbia | $-908.9M | |||
| 29/11 11:00 | industrial production | Serbia | 4.6% | |||
| 29/11 11:00 | retail sales yoy | Serbia | 3.1% | |||
| 29/11 11:00 | unemployment rate | Serbia | 9.2% | |||
| 29/11 11:30 | government budget value | Brazil | BRL-53.767B | |||
| 29/11 11:30 | foreign exchange reserves | India | ||||
| 29/11 11:30 | loan growth | India | ||||
| 29/11 12:00 | unemployment rate | Brazil | 6.4% | |||
| 29/11 12:00 | gdp annual growth rate | India | 6.8% | |||
| 29/11 12:00 | industrial production | Chile | ||||
| 29/11 12:00 | retail sales mom | Chile | 0.4% | |||
| 29/11 12:00 | retail sales yoy | Chile | 3.9% | |||
| 29/11 12:00 | unemployment rate | Chile | 8.7% | |||
| 29/11 13:30 | gdp growth rate | Canada | 0.5% | 0.6% | ||
| 29/11 13:30 | gdp growth annualized | Canada | 2.1% | 2.8% | ||
| 29/11 14:45 | chicago pmi | United States | 41.6 | |||
| 29/11 16:00 | government budget value | Canada | C$-2.55B | C$ -0.82B | ||
| 29/11 23:50 | retail sales mom | Japan | -2.3% | |||
| 29/11 23:50 | retail sales yoy | Japan | 0.5% | |||
| 30/11 01:30 | business confidence | China | 50.1 | |||
| 30/11 01:30 | non manufacturing pmi | China | 50.2 | |||
| 01/12 00:00 | balance of trade | South Korea | $3.17B | |||
| 01/12 22:00 | manufacturing pmi | Australia | 47.3 | 48 |
World Economic Overview interpretation
MacroVar presents here the following important leading, coincident and lagging indicators of the largest economies of the world:- Manufacturing PMI: Manufacturing PMI is a leading indicator of the manufacturing dynamics of a specific country. A pmi higher than 50 indicates expansion while lower than 50 indicates contraction. The absolute value represents the trend in manufacturing performance.
- Manufacturing Y/Y%: Manufacturing PMI Year-over-Year (YoY) refers to the change in the Purchasing Managers' Index for the manufacturing sector over the same month in the previous year. It provides a perspective on how the manufacturing sector has performed over the past year, highlighting trends in growth or contraction. The Year over year value represents the manufacturing in manufacturing performance.
- Manufacturing M/M%: Manufacturing PMI Month-over-month (YoY) refers to the change in the Purchasing Managers' Index for the manufacturing sector over the previous month.
- Services PMI: Services PMI is a leading indicator of the services dynamics of a specific country. A pmi higher than 50 indicates expansion while lower than 50 indicates contraction.
- Services Y/Y%: Services PMI Year-over-Year (YoY) refers to the change in the Purchasing Managers' Index for the Services sector over the same month in the previous year. It provides a perspective on how the Services sector has performed over the past year, highlighting trends in growth or contraction. The Year over year value represents the Services in Services performance.
- Services M/M%: Services PMI Month-over-month (YoY) refers to the change in the Purchasing Managers' Index for the Services sector over the previous month.
- GDP: Gross Domestic Product (GDP) is a key economic coincident indicator used to measure the overall economic performance of a country. It is based on data from the World Bank.
- GDP Y/Y%: Gross Domestic Product (GDP) (YoY) refers to the expansion or contraction of a country's GDP on an annualized basis.
- CPI: The Consumer Price Index (CPI) is a measure that examines the weighted average of prices of a basket of consumer goods and services. It is used to calculate the cost of living and is a key indicator of inflation, which reflects the rate at which the general level of prices for goods and services is rising, and subsequently, how much purchasing power is eroding.
- CB: The Consumer Price Index (CPI) is a measure that examines the weighted average of prices of a basket of consumer goods and services. It is used to calculate the cost of living and is a key indicator of inflation, which reflects the rate at which the general level of prices for goods and services is rising, and subsequently, how much purchasing power is eroding.
- CB: Central bank interest rates, are crucial tools used by central banks to influence a country's economy.
- CB B/S YoY: The year-over-year (YoY) analysis of a central bank's balance sheet involves comparing the balance sheet at the end of a given year with its state at the end of the previous year. This analysis provides insights into how the central bank's assets and liabilities have changed over a 12-month period.
- Government Budget: A government budget is a financial statement presenting the government's proposed revenues and spending for a specific financial year.
- Debt/GDP: Debt-to-GDP ratio is a key economic metric that compares a country's public debt to its gross domestic product (GDP). This ratio is expressed as a percentage and is used to gauge the country's ability to pay back its debt.
- CA: Surplus and Deficit: A current account surplus indicates that a country is a net lender to the rest of the world, exporting more than it imports. Conversely, a deficit suggests that a country is a net borrower, importing more than it exports. Implications for the Economy: Persistent deficits can lead to increased foreign debt and may reflect underlying economic issues, such as a lack of competitiveness. Surpluses might indicate strong economic fundamentals but can also lead to tensions with trading partners. A current account deficit must be financed by a capital account surplus and vice versa.
- UE: The unemployment rate is a measure of the prevalence of unemployment and it is calculated as the percentage of those in the labor force who are unemployed.
World economic model
Macroeconomics analyses the performance of a nation's overall economy using macroeconomic indicators like GDP, inflation, unemployment and Government Debt. This section analyses applied macroeconomics used by investors and traders to predict the World economy and countries’ economic and financial markets.These principles are based on models and documentation of Ray Dalio, the founder of the world's largest hedge fund Bridgwater associates.
An economy is the sum of the transactions that make it up. A country's economy is comprised of the public and private sector. The private sector is comprised of businesses and consumers. There are two types of businesses manufacturing, and services. A country’s economy is also affected by the World economy since capital and products flow between countries.
Economic Aim: A nation's economy is healthy when there is real economic growth combined with steady inflation, low unemployment, and low debt.
Economic Growth: Economic growth is measured by GDP (Gross Domestic Product). There are two forms of GDP monitored. Nominal GDP and Real GDP. Nominal GDP is the total income of a country in a year. Real GDP is the total income of a country adjusted for inflation.
Inflation: Inflation (commonly measured by the country’s CPI) measures the rate of increase of the average prices of goods and services in an economy. When prices rise the purchasing power of money falls and vice-versa. Policymakers target an inflation rate of 2% which is considered healthy. Zero or negative inflation rates and high inflation rates of 4-5% are damaging for the economy. Hence policymakers react using monetary and fiscal policies. Learn more about the types and positive and negative effects of inflation.
Economic activity is driven by 1. Productivity growth (GDP growth 2% per year due knowledge increase), 2. the Long-term debt cycle (50-75 years), 3. the business cycle (5-8 years).
Credit (promise to pay) is driven by the debt cycle. If credit is used to purchase productive resources, it helps economic growth and income. If credit is used for consumption it has no added value (version 2 expand on this)
These factors cause economic cycles which has the following stages: 1. Expansion, 2. Peak, 3. Recession, 4. Depression, 5. Trough, 6. Recovery. Explore the macroeconomic cycle in detail.
Money and Credit: Economic transactions are filled with either money or credit (promise to pay). The availability of credit is determined by the country’s central bank. The degree to which debt is healthy for the economy depends on whether borrowed money is used productively to generate sufficient income to service the debt or not.
Country versus Rest of the World: A country’s finances consist of a simple income statement (revenue–expenses) and a balance sheet (assets–liabilities). Exports are imports are the main revenue and expense for countries. Uncompetitive economies have negative net income (imports higher than exports), which is financed by either savings (FX & Gold reserves) or rising debt (owed to exporters).
Debt: A nation’s debt is categorized as local currency debt and FX debt. Local debt is manageable since a country’s central bank can print money and repay it. FX debt is controlled by foreign central banks hence it is difficult to be repaid. For example. Turkey has US dollar denominated debt. Only the US central bank (the Federal Reserve), can print US dollars hence FX debt is out of Turkey’s control.
A country can control its debt by either: 1. Inflate it away, 2. Restructure, 3. Default. The US aims to keep nominal GDP growth above interest rates (kept low) to gradually reduce its debt.
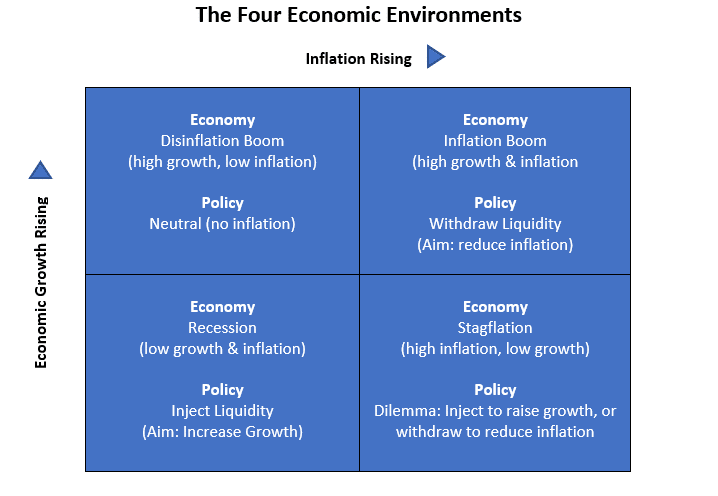
Economic Growth vs Inflation Model
A nation’s economy is constantly changing and is affected by the country’s macroeconomic dynamics and its economic performance relative to the rest of the World (RoW).
The country’s policymakers (government and central bank) monitor economic conditions and use fiscal policy and monetary policy to control economic growth and inflation.
During recessions and depressions policymakers inject liquidity in the financial system to make new borrowing and repaying of existing debt easier. Conversely, during strong economic expansions accompanied with rising inflation, policymakers withdraw liquidity from the financial system to slowdown new debt and credit and reduce aggregate demand.
The diagram below shows what is the policy followed during four economic environments of inflation versus economic growth.